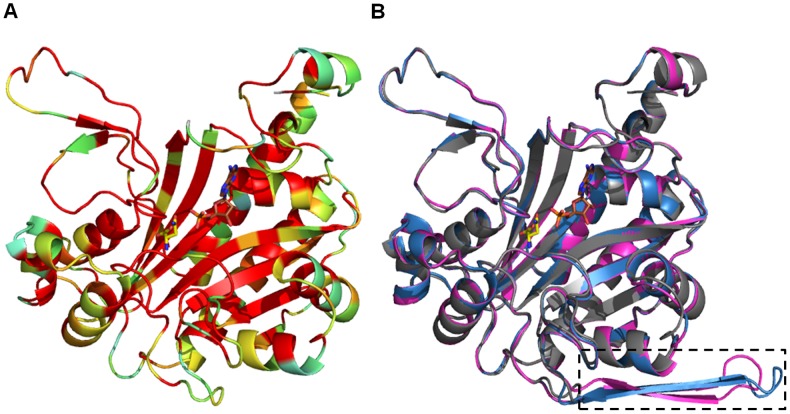
Figure 2. Homology models of AS-A from trypanosomes.
(A) Ribbon representation of EcAS-A colored according to the sequence similarity with TbAS-A and TcAS-A as shown in Fig. 1. (B) Superposition of EcAS-A structure (grey) (PDB accession code 12AS), with TbAS-A (blue) and TcAS-A (purple) homology models (obtained from the SWISS-MODEL server, using PDB 12AS as a template). A small structurally divergent region is marked by a dashed rectangle. Ligand color schemes: asparagine is shown in yellow (oxygen, red; nitrogen blue) and AMP is shown in brown (oxygen, red; nitrogen blue; phosphorous orange).

