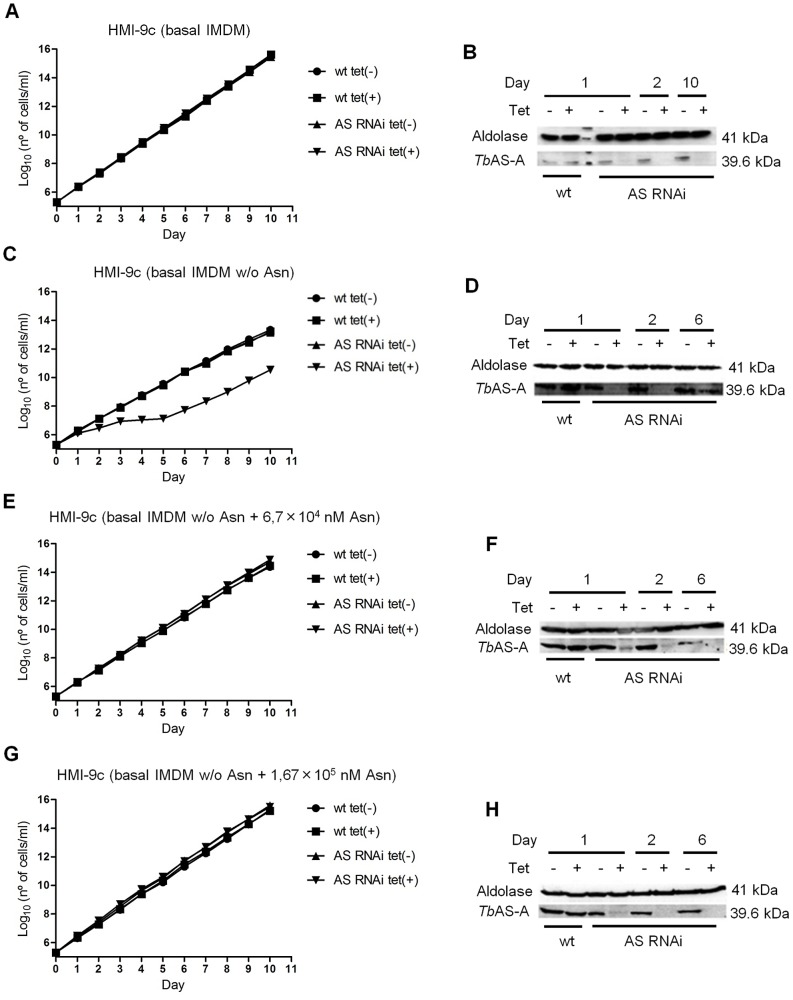
Figure 6. In vitro effect of RNAi-mediated AS-A down-regulation in T. brucei bloodstream forms.
Growth curve of a wt versus a representative AS RNAi cell line were performed in unmodified medium [complete HMI-9 (HMI-9c) with basal IMDM] (A), modified medium [HMI-9c with basal medium without asparagine - HMI-9c (basal IMDM w/o Asn)] (C), modified medium supplemented with 6.7×10⁴ nM of asparagine [HMI-9c (basal IMDM w/o Asn + 6.7×10⁴ nM Asn)] (E), modified medium supplemented with 1.67×10⁵ nM of asparagine [HMI-9c (basal IMDM w/o Asn + 1.67×10⁵ nM Asn)] (G). Circles and squares represent wild-type growth in the absence or presence of tetracycline, respectively, while up triangles and down triangles represent clones growth in the absence or presence of tetracycline, respectively. Cumulative cell numbers are plotted as the product of cell number and total dilution. Error bars indicate standard deviation. The effect of RNAi on the AS-A protein levels was analyzed by Western blots with extracts of noninduced tet(−), and RNAi-induced tet(+) cells, isolated from unmodified medium (B), modified medium (complete HMI-9 medium with basal IMDM without asparagine) (D), modified medium supplemented with 6.7×10⁴ nM of asparagine (F), modified medium supplemented with 1.67×10⁵ nM of asparagine (H). Cells were collected at day 1, 2, 6 and 10 of RNAi induction. Results are representative of three independent experiments.

