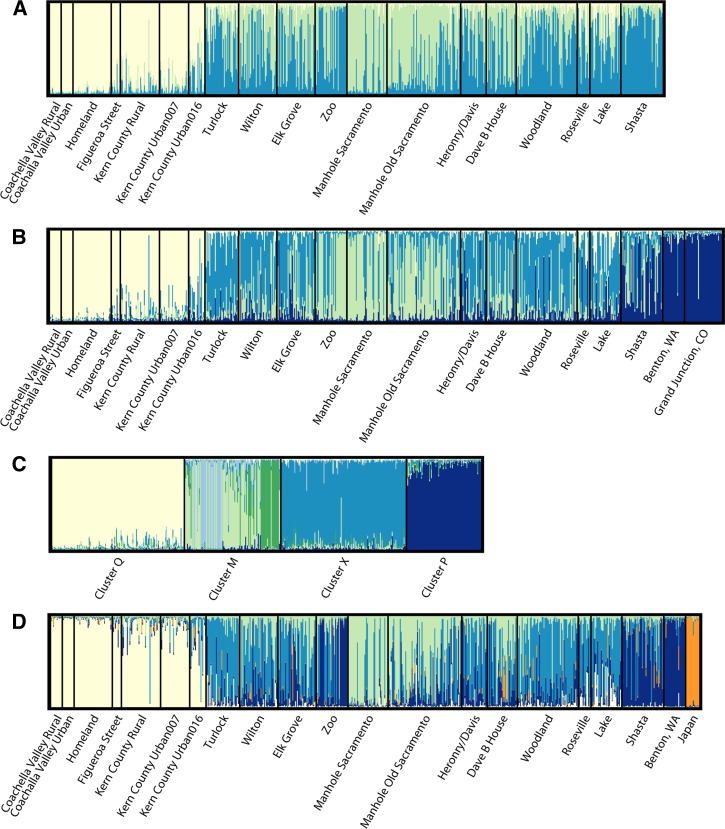
Figure 3.
Structure diagrams showing most likely numbers of clusters. Colors correspond to the same clusters for each panel: Cluster Q, light yellow; Cluster P, dark blue; Cluster M, light green; Cluster X, medium blue. A, California Culex pipiens complex populations, K = 3. B, populations as in A with the addition of populations from Benton, Washington and Grand Junction, Colorado, K = 4 (see text). C, When highly admixed individuals are removed from the analysis, the most likely number of clusters is K = 6, and cluster M further subdivides, with the Manhole Sacramento (light blue) and Zoo (green) populations becoming distinct. D, California and Benton, Washington populations, with the addition of 15 Cx. pipiens pallens individuals from Japan (in orange), K = 5.

