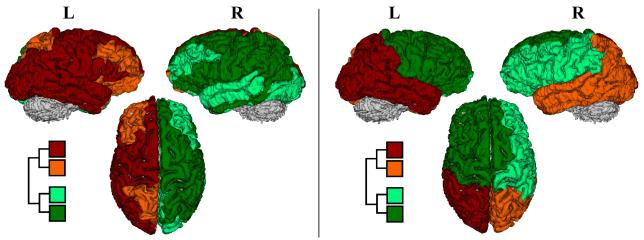
Fig. 1.
First two levels of modular or community structure via the Q modularity (left) and ΨPL (right). Notice that at the first level, the constructed mean tree by maximizing Q exhibits a left/right parcellation while the constructed mean tree using ΨPL exhibits an anterior/posterior partitioning along the frontal-parietal junction.

