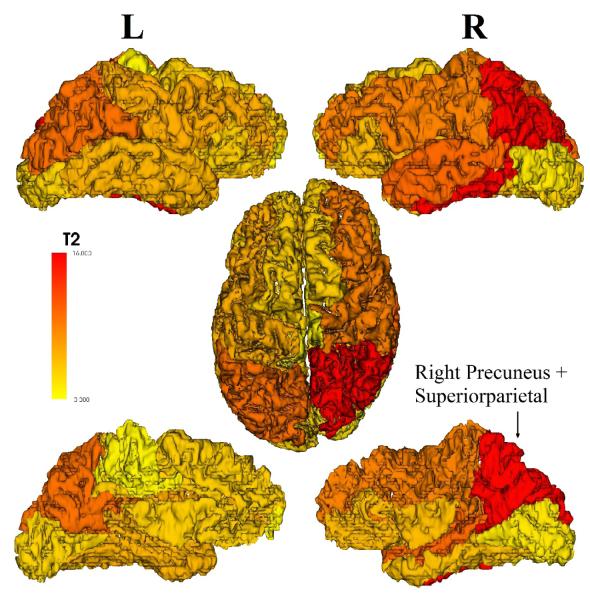
Fig. 2.
Hotelling’s T-Squared statistics are overlaid on the 16 communities of the reference tree, showing regional group differences in the community structure between groups. The most significant differences are in the right precuenus and superior parietal gyrus. This figure is showing a left/right lateral view (top), an axial view (middle) and a left/right mid-line view (at the bottom). The community containing the right precuneus and the right superior parietal gyrus is highlighted in red.

