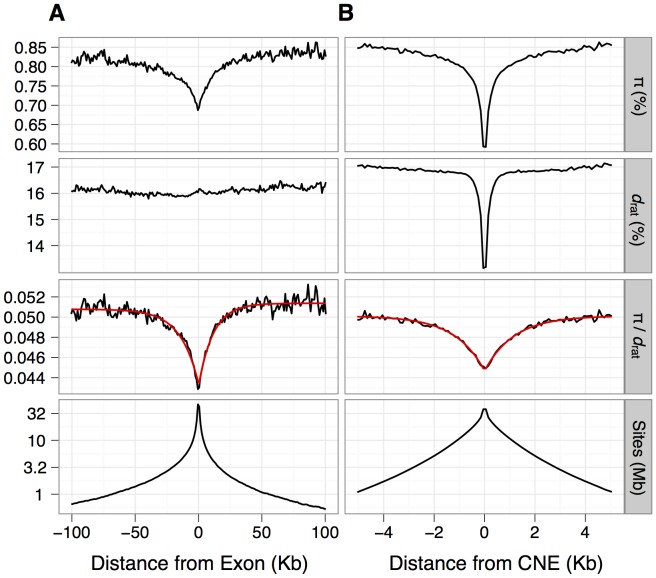
Figure 1. Estimates of mean nucleotide diversity (π) in house mice, divergence to rat (drat) and their ratio (π/d) plotted against the distance from the nearest protein-coding exon (panel A) or CNE (panel B).
Mean estimates of π/d can be approximated well by a negative exponential function (red line), obtained by fitting the function f(x) = A(1-B(exp(-x/d))) to mean π/d by nonlinear least squares (see Materials and Methods for details). The bottom panel shows the number of sites (in Mb) on a log scale that contribute to each bin.

