
Figure 3. Mitochondrial membrane potential of T. cruzi trypomastigotes treated with soulamarin* (p<0.05).
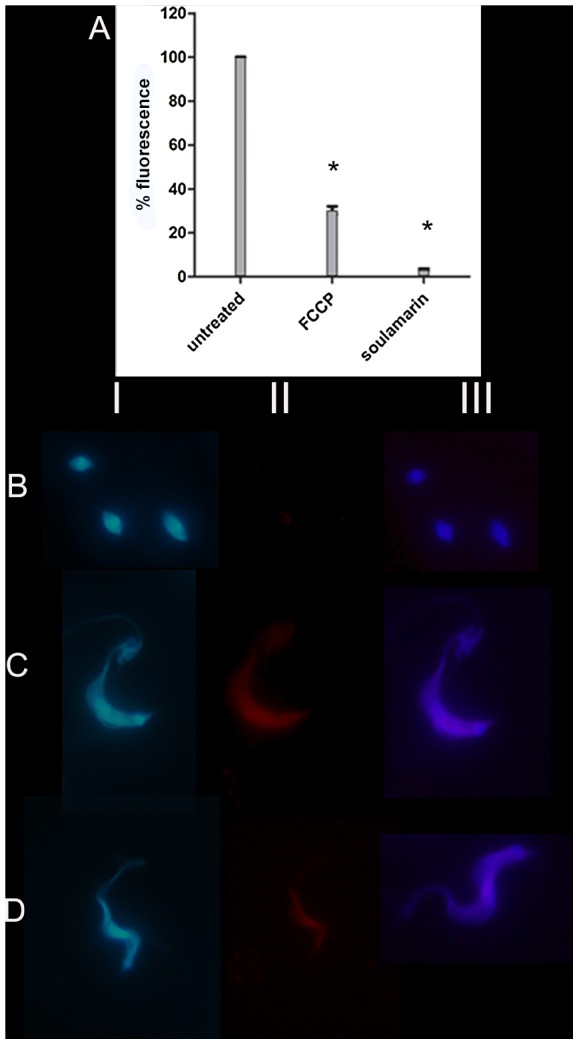
(A): Microplate spectrofluorimeter data showing soulamarin-treated T. cruzi, positive control (FCCP), and negative control (untreated cells). (B–D): Fluorescence microscope images, B - soulamarin-treated T. cruzi; C - untreated T. cruzi (negative control); D – FCCP (positive control). Panels I - images with blue fluorescence channel (DAPI); panels II - images with red fluorescence channel (MitoTracker Red); panels III - merged images (excitation and emission wavelengths of 540 and 595 nm; 1000×magnification).