
Figure 2.
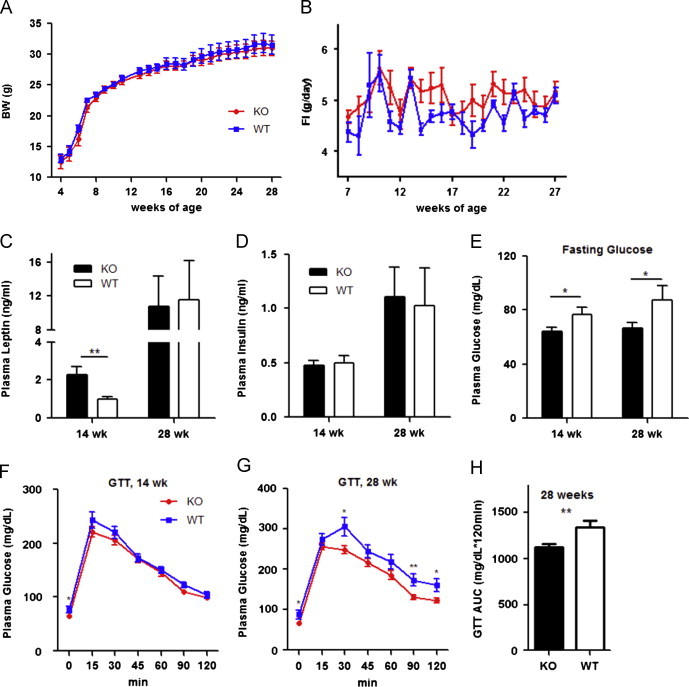
Phenotypic assessment of ObRa KO mice on regular chow diet. ObRa KO and WT male littermates were fed with regular chow (10% fat). Body weight, food intake, plasma leptin, insulin, fasting blood glucose and GTT were measured. (A and B) Body weight and food intake in littermates of ObRa KO (n=13 for BW and n=24 for FI) and WT (n=6 for BW and n=10 for FI) male mice showed no significant difference (p>0.05 at all time-points). (C) Plasma leptin was elevated in 14 week old male ObRa KO (n=23) vs. WT (n=10) mice (2.26±0.45 vs. 0.98±0.14 ng/ml, p<0.01) but similar in 28 week old mice (10.79±3.55 vs. 11.56±4.57 ng/ml, p>0.05). (D) Plasma insulin levels showed no significant difference in male ObRa KO (n=24 and 13) and WT littermates (n=10 and 6): 14-week: 0.47±0.05 vs. 0.50±0.07 ng/ml, p>0.05; 28-week: 1.11±0.27 vs. 1.02±0.35 ng/ml, p>0.05. (E) Fasting glucose was significantly reduced in ObRa KO mice (n=35 and 13) vs. WT mice (n=16 and 6) at both 14 week (64.4±2.6 vs. 76.5±7.0 mg/dL p<0.05) and 28 week of age (66.5±4.21 vs. 87.3±10.8 mg/dL, p<0.05). (F and G) Glucose tolerance tests showed no significant difference in 14 week old ObRa KO vs. WT littermates (n=35 and 16 respectively, p>0.05 for paired comparison at each time-point) but significant improvement in 28 week old male littermates (n=13 for KO and 6 for WT; 30, 90, 120 min post-injection: 247.8±10.5 vs. 305.3±23.6 p<0.05, 130.6±6.4 vs. 173.2±5.4 p<0.01, 122.8±6.0 vs. 160.7±16.4 p<0.05). (H) Area Under the Curve (AUC) calculation for the GTT at 28 weeks of age showed that ObRa KO had significantly better GTT performance than WT (1131±34.29 vs. 1340±74.87 mg/dL⁎120 min, p<0.01).