
Figure 4.
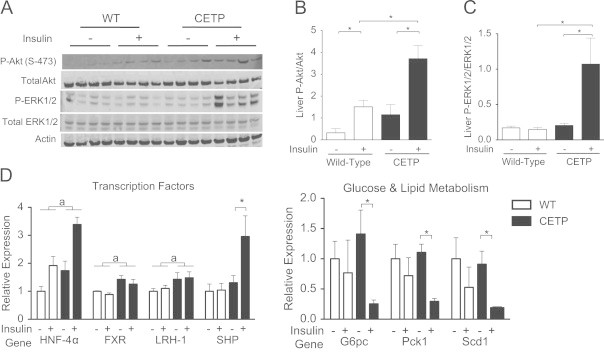
CETP expression alters hepatic insulin signaling and bile acid signal related gene expression. (A) Immunoblot analysis of Akt, P-Akt (S-473), Erk1/2, P-Erk1/2, and actin in liver whole-cell extract from fasted and clamped CETP and WT female mice on a high fat diet. (B) Quantification of P-Akt to Akt ratio. (C) Quantification of P-Erk1/2 to Erk1/2 ratio. (D) Gene expression for genes whose products control glucose metabolism, bile acid metabolism, and gene transcription determined by qRT-PCR from hepatic RNA. Data represents the mean±SEM from n=4 animals per group. Asterix (*) indicates p<0.05 for insulin-treated versus fasted, brackets (a) indicate statistical significance (p<0.05) for genotype effect by 2-way ANOVA.