
Figure S3.
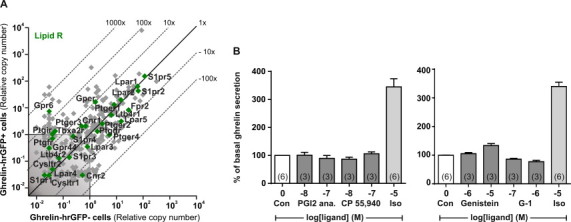
Expression and functional analysis of lipid 7TM receptors in ghrelin cells. (A) qPCR data for 379 7TM receptors examined in FACS-separated hrGFP-positive (Y-axis) and hrGFP-negative (X-axis) gastric mucosal cells from ghrelin-hrGFP mice. Lipid receptors are marked with green. (B) Acyl-ghrelin release from primary gastric mucosal cells treated with a stable prostaglandin I2 analog (PGI2, beraprost), a CB1 agonist (CP 55,940), the GPER agonists genistein and G-1 or isoproterenol. The data has been normalized to the basal secretion of ghrelin from vehicle-treated cells and shown as means±SEM. Number of repeated experiments is written in brackets in each bar.