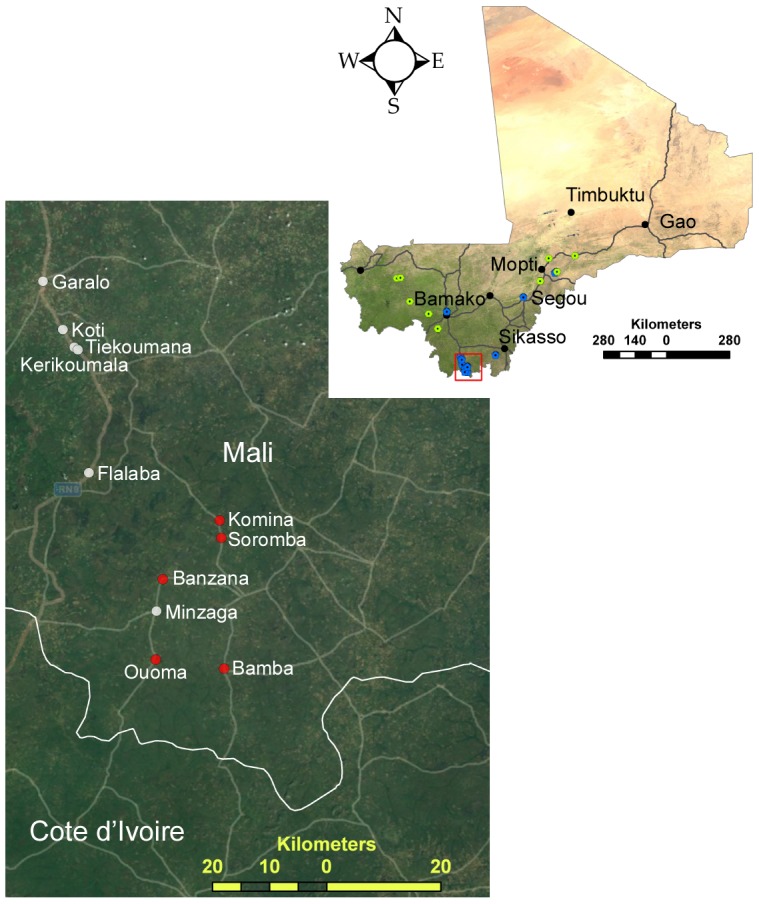
Figure 1. Map of Mali depicting the various locations where small mammals were trapped.

Sera and tissue samples were collected at some locations (blue dots) whereas at other locations only sera were collected (green dots). The major cities of Mali are represented by black markers. Inset is an expanded view of southern Mali where the occurrence of Lassa virus infected rodents was documented. The sampled villages are named, and red markers indicate villages where Lassa virus infected rodents were documented. The maps were generated using ESRI ArcMap 10.1; the map of Mali utilizes an ESRI satellite imagery basemap and the inset utilizes an ESRI basemap with the imagery and transportation layers activated, both supplied with the GIS software.
