Fig.A.

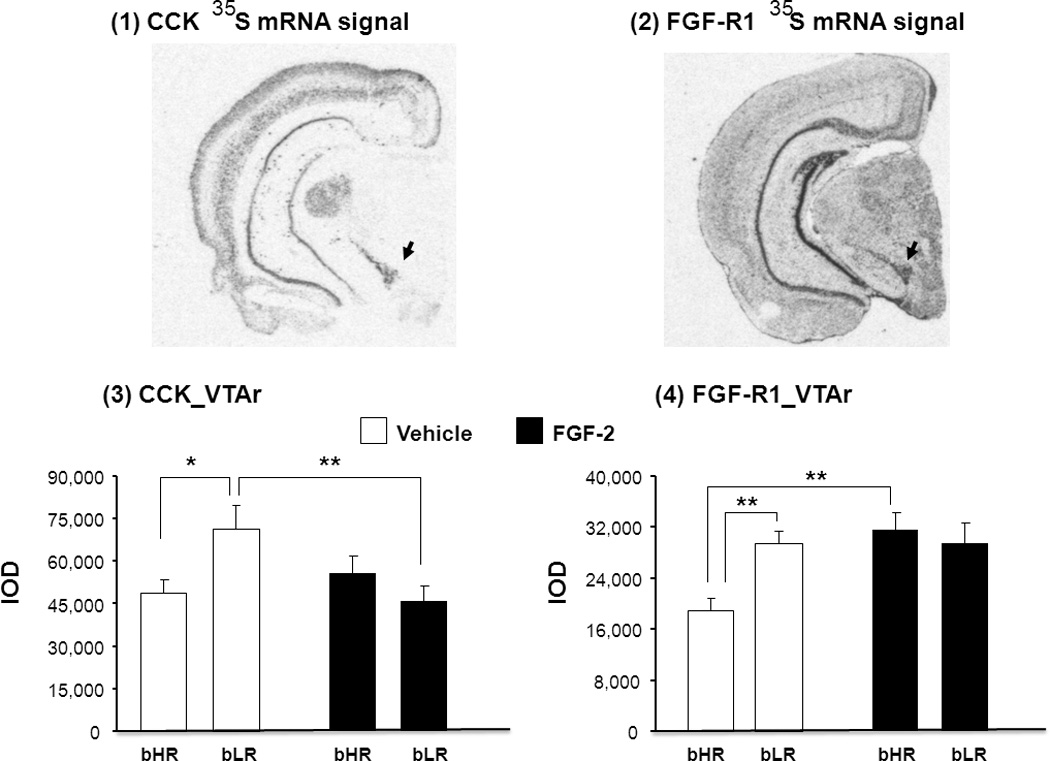
Representative autoradiograms illustrate 35S-mRNA hybridization signal for CCK (1) and FGF-R1 (2) in selected coronal hemi-sections (approx. 5.22mm posterior to Bregma) through the rostral VTA (VTAr; black arrows). The effects of repeated FGF-2 treatment on CCK (3) and FGF-R1 (4) mRNA levels are shown. Transcript levels are expressed as integrated optical density (IOD) units. Data are in mean ± S.E.M., *P<0.05, **P<0.01. N= 6–7 for each treatment group.
