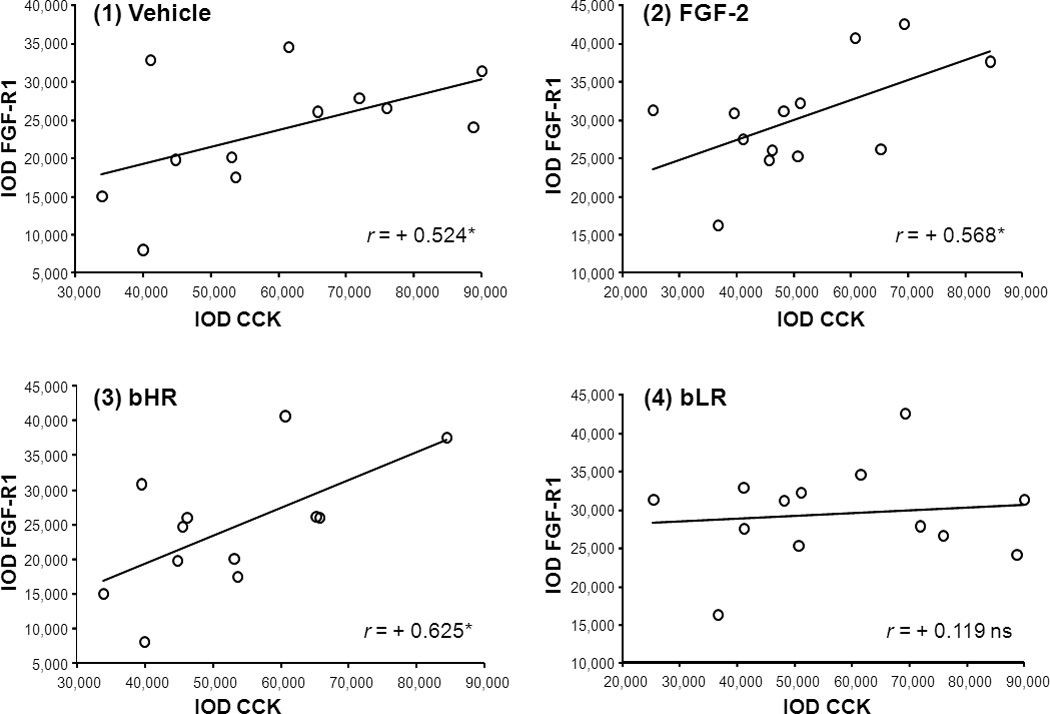
Fig.B.

Scatter plots illustrate the relationship between CCK and FGF-R1 gene expression in (1) vehicle-treated, (2) FGF-2-treated, (3) bHR, and (4) bLR rats. For the analyses examining the correlation between CCK and FGF-R1 in vehicle (1) and FGF-2-treated (2) rats data from bHRs and bLRs were pooled. Alternatively, vehicle- and FGF-2-treated data were pooled when examining CCK and FGF-R1 correlations in bHR (3) vs bLR (4) rats. The abscissa represents CCK mRNA expression levels while the ordinate axis represents FGF-R1 mRNA levels in IOD units. The correlation index (r) denotes the strength of the association between variables. *P< 0.05 N = 12–13 (Pearson’s correlation analyses).
