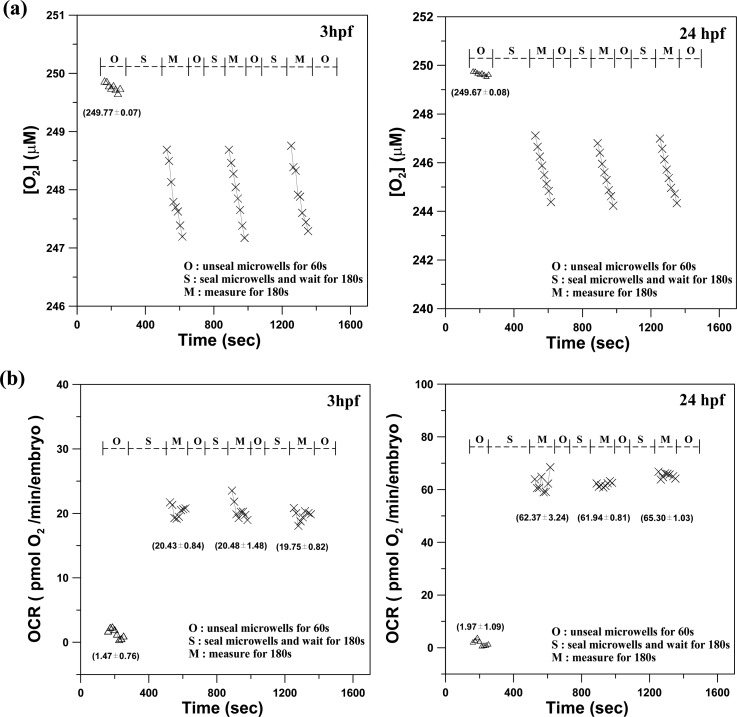
Figure 5.
(a) The time variation of the oxygen concentration [O2] and (b) the oxygen consumption rate of a single developing zebrafish embryo (OCR(t), −d[O2]/dt) at 3 hpf and 24 hpf inside microwells for 3 successive measurements. These measurements were performed by a periodic three-stage operation of replenishing the microwell with fresh medium (O-stage), sealing the microwell (S-stage), and measuring the oxygen concentration (M-stage). (Mean ± SEM; n > 8).

