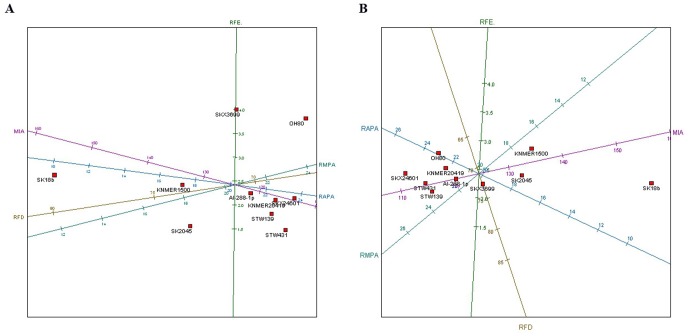
Figure 3. PCA showing the OH80 radius compared to other australopithecine and Homo fossils.
A, confirmatory PCA of the variables analyzed for several fossil hominin proximal radial specimens (excluding the variable AP ratio, since predictive diagrams suggested that it was not diagnostic and that it had three times more predictive error margin than the variable with the smallest error and 50% more error than the other variables). The PCA yielded a two-component solution, which accounted for 91.9% of the sample variance. Dimension 1 accounted for 70% of the sample variance; dimension 2 explained the remaining 21.9% of variance. The variables showing the highest scores in factor 1 were MIA (.51), RAPA (−.50), RMPA (−.48) and RFD (−.47). In the second factor, RFE yielded the highest score (.97). B, A similar distribution of the sample can be observed in a MDS analysis, which reached a solution after 77 iterations, consisting of a two-dimensional solution explaining 89.2% of sample variance. The first dimension (71% of inertia) showed the same variables selected as in the PCA but with different scores: MIA (.89), RAPA (.28), RMPA (−.23), RFD(.24). The second dimension is defined by RFD (−.73). Abbreviations: medial proximal-distal intersecting angle (MIA); relative fovea diameter (RFD); relative fovea eccentricity (RFE); relative anterior proximal articular surface width (RAPA); relative medial proximal articular surface width (RMPA) [25]. Horizontal axes display the first dimension and vertical axes show the second dimension of data. Fossils (catalog number, species): KNM-ER 20419, Australopithecus anamensis; AL-288-1p, Australopithecus afarensis; StW 431, Australopithecus africanus; StW 139, Australopithecus africanus; SKX 3699, Paranthropus robustus; SKX 24601, Paranthropus robustus; KNM-ER 1500, Paranthropus boisei; SK18b; Homo erectus; SK 2045, (?) Homo erectus.

