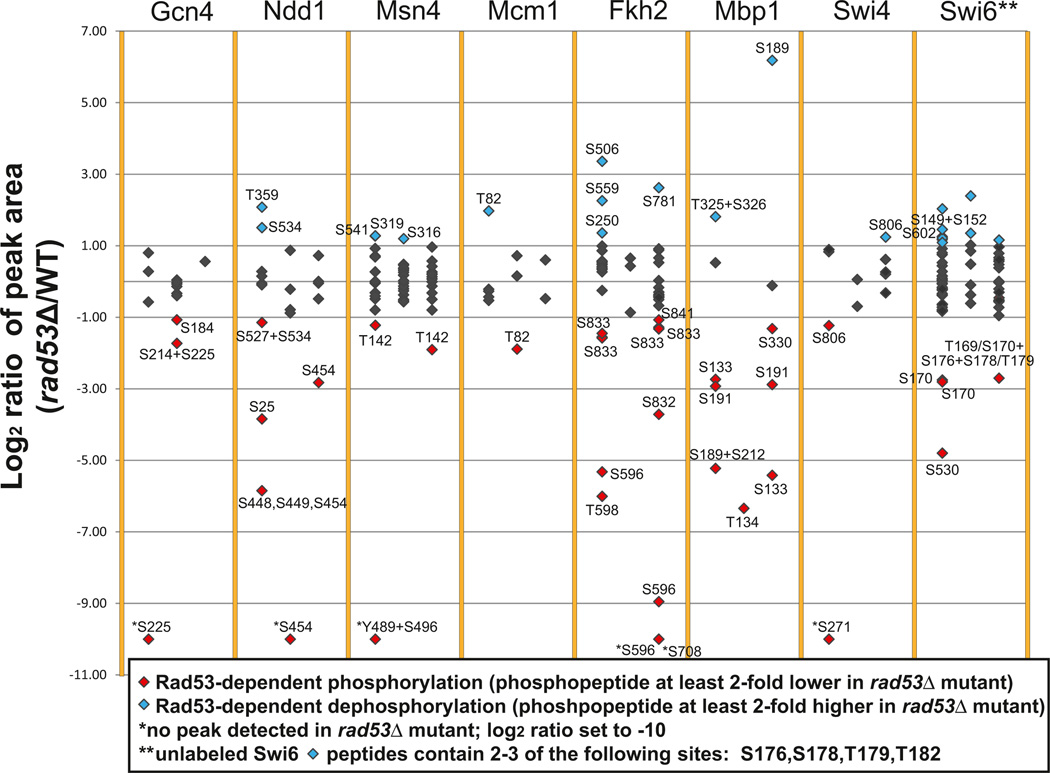
Figure 4. Rad53-Dependent Phosphorylation of Downstream TFs.
The log2 ratios obtained from SILAC analysis of the rad53Δ mutant relative to WT for each individual peak identifying a peptide with a phosphorylation site are shown. Data for each of three independent experiments are shown as adjacent scatterplots for each TF. Complete data for all of the peptides identified are presented in Table S8.

