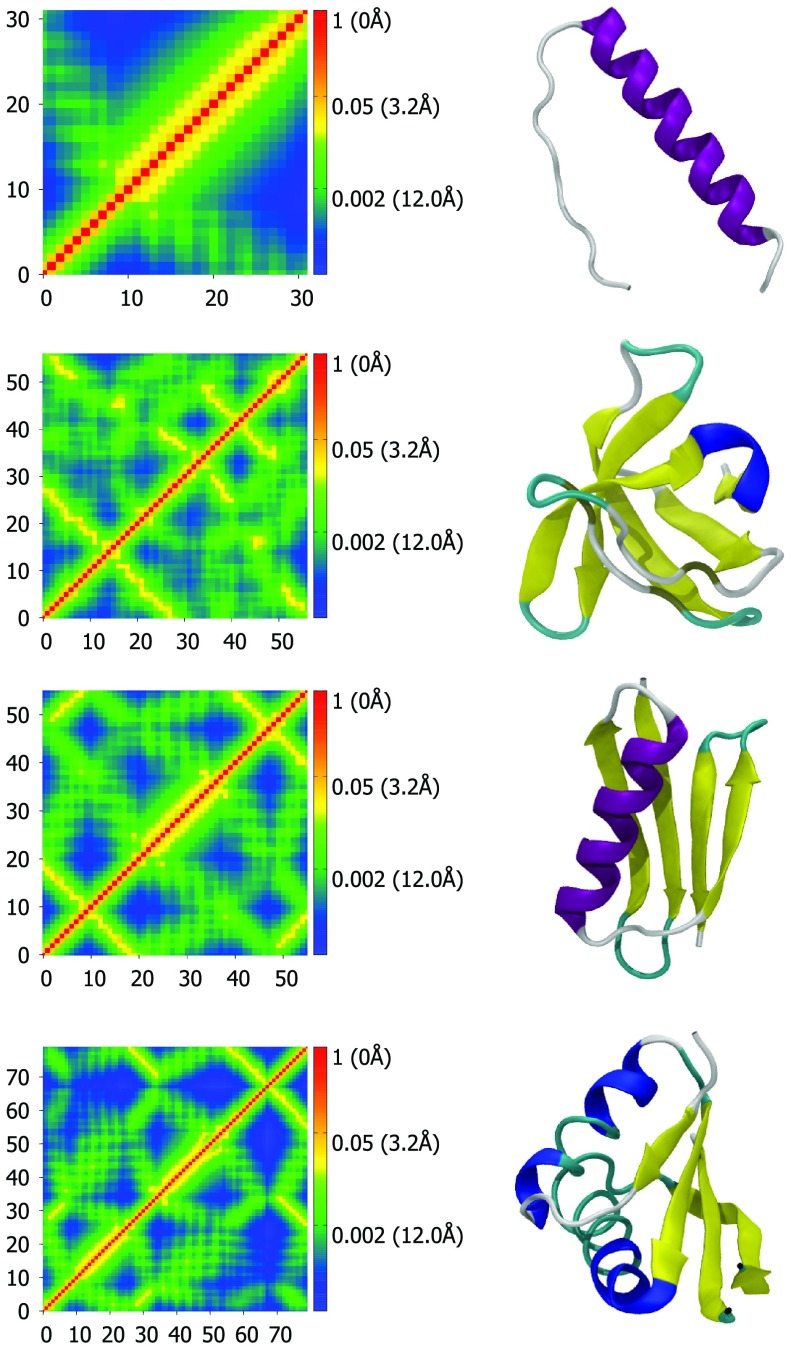
Figure 1.
Correlation maps (left column) and secondary structure representations (right column) for proteins 1C26, 1BK2, 1PGA, and 1NH9, from top to bottom. Correlation maps are generated using Eq. 48 with υ = 2.5 and η = 1.0 Å. Secondary structure visualizations are generated with VMD.30 Colors represent distance and correlation values for each pair of atoms. Red represents nearby atoms with high correlation values and blue represents distant atoms with low correlation values. The residue numbers for each Cα are listed along the x- and y-axes. The protein are displayed in VMD's “new cartoon” representation and colored by secondary structure determined by STRIDE. The color scheme for secondary structure is: Purple – α helix, blue – 3(10) helix, yellow – β-sheet, cyan – turn, white – coil. The correlation map of an α helix gives rise to a widened diagonal pattern (see the first row). In contrast, the correlation map of paired beta sheets has two patterns. One is a line that is perpendicular to the diagonal with distances around 5-10 Å for a pair of anti-parallel beta sheets (see the first and second beta sheets in the third row). The other is a line that is parallel to the diagonal with distances around 5-10 Å for a pair of parallel beta sheets (see the first and fourth beta sheets in the third row).

