
Figure 2.
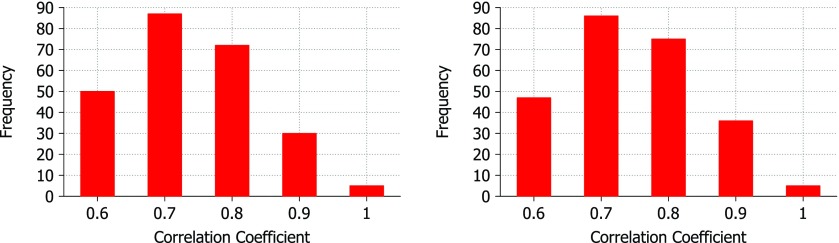
Correlation coefficients for experimental vs predicted B-factors using the Lorentz kernel (left) and exponential (right) kernel. The test set consists of 263 Cα only PDB files. Scores below 0.5 are not shown. For the Lorentz kernel, υ values range from 0.5 to 10.0 at an interval of 0.5 and η values range from 1.0 Å to 40.0 Å at an interval of 1.0 Å. For the exponential kernel, κ values range from 0.5 to 10.0 at an interval of 0.5 and η values range from 0.5 Å to 20.0 Å at an interval of 0.5 Å.