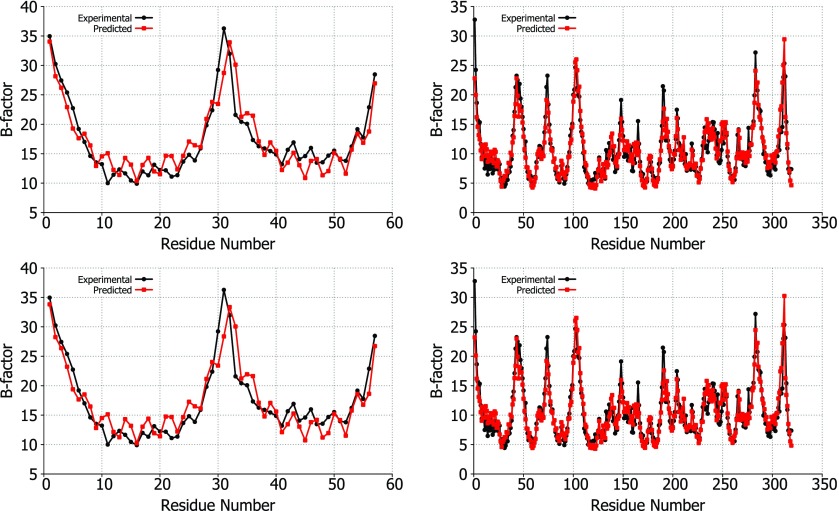
Figure 3.
Experimental B-factors (black) vs predicted B-factors (red) using the Lorentz (top) and exponential (bottom) correlation kernels. The structures used for comparison are 1DF4 (left) and 2Y7L (right). For these comparisons, the optimal parameters were used for υ, κ, and η based on the parameter searches for each correlation kernel. For the Lorentz kernel, υ = 1.5 and η = 2.0 Å are the parameters used for 1DF4 and υ = 1.5 and η = 19 Å are used for 2Y7L. For the exponential kernel, κ = 0.5 and η = 1.0 Å are employed for 1DF4 and κ = 0.5 and η = 2.5 Å for 2Y7L.

