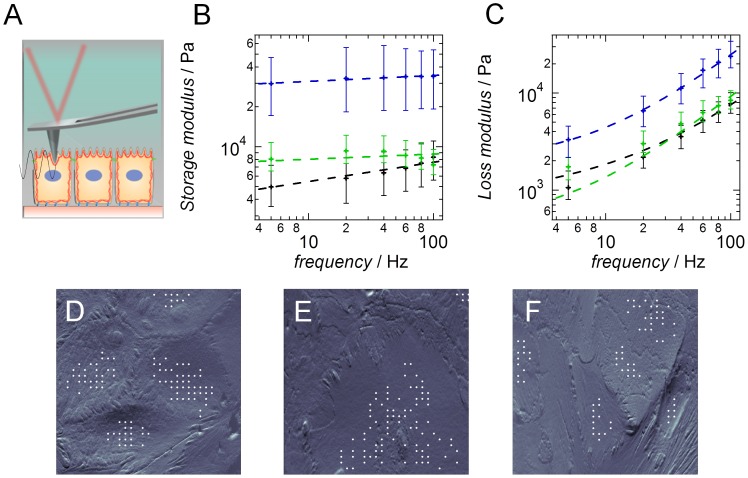
Figure 4. Viscoelastic properties of NMuMG cells during epithelial-to-mesenchymal transition.
(A) Scheme of microrheological setup. Upon indentation of the sample, the AFM cantilever is excited sinusoidally and force curves are recorded within a predefined area. (B) Calculated storage modules of untreated NMuMG cells (black, n = 106), NMuMG cells during EMT (green, n = 90) and NMuMG cells within the final mesenchymal-like state (blue, n = 73). (C) Calculated loss modules. Color coding as in B. The dashed lines show the corresponding fits according to the power-law structural damping model [51]. n depicts the number of curves used for calculation. (D–F) AFM deflection images of living NMuMG cells during the transition. Untreated NMuMG cells (D), NMuMG cells treated 24 h with TGF-β1 (E) and NMuMG 48 h after administration of TGF-β1 (F). White points mark the positions of the recorded force curves on the cellular bodies used for analysis omitting the stiffer cell-cell borders.

