
Figure 3. Venn diagrams for significant gene regulations associated to anhedonia and treatment recovery.
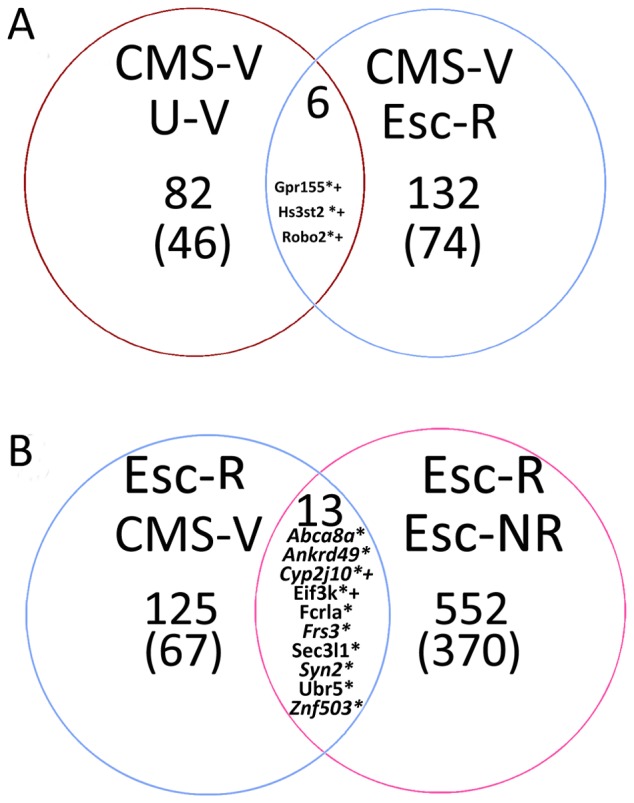
. (A) Associated gene differences in comparisons between vehicle-treated anhedonic-like (CMS-V) versus unchallenged control groups (left panel) and CMS-V versus treatment responders (right panel); (B) associated gene differences according to response to treatment between escitalopram responders versus CMS-V (left panel) and versus treatment non-responders (right panel). Results in parentheses indicate amount of genes identified in the NCBI database. All identified genes present in the intersection areas are listed by gene symbols. U-V, vehicle treated unchallenged control rats; Esc-R, CMS escitalopram responders; Esc-NR, CMS escitalopram non-responders. * – significant changes by qPCR for left side comparisons; + – significant changes by qPCR for right side comparisons.