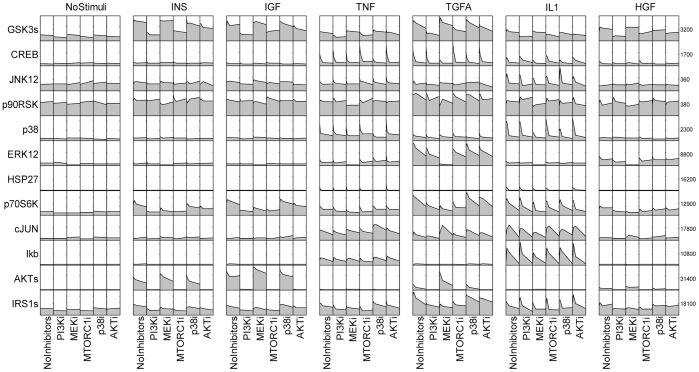
Figure 12. Cue signal response data of primary human hepatocyte.
Each column represents a treatment condition which combines an inhibitor (or no inhibitor) and a ligand (or no ligand) while each row represents the measurement on each protein. The curve in each box shows the protein level variation at four time points.

