
Figure 8.
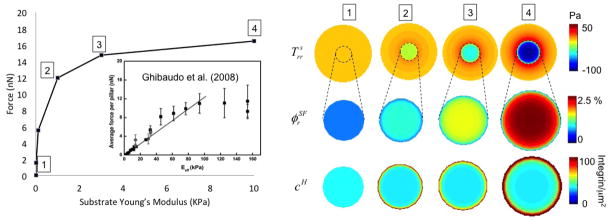
Left: Relationship between cell contraction and cell area for different substrate stiffness. The model predicts a nonlinear relationship between contraction and substrate stiffness in agreement with experiments on micropillars [26]. For comparison purposes, the simulated force in the ordinate is equal to the total computed integrin force divided by the number of pillars from experimental images and multiplied by the ratio of cell areas obtained from experiments and simulations. Right: The evolution of radial stress in the substrate, volume fraction of stress fibers in the radial direction and the concentration cH of high affinity integrins are also shown for different substrate stiffness.