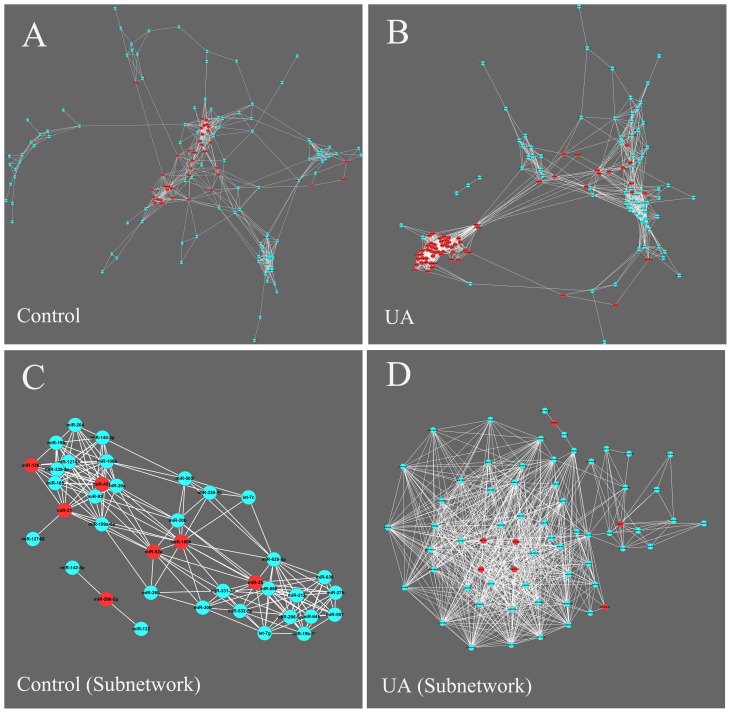
Figure 7. Coexpression network analysis of circulating miRNAs in UA patients and controls.
(A–B) Coexpression network constructed with all detected miRNAs. Nodes represent individual miRNAs, and edges represent coexpression relationships between miRNA pairs. PCR-validated miRNAs (miR-106b, miR-25, miR-92a, miR-21, miR-590-5p, miR-126*, and miR-451) and their first neighbors are labeled with red nodes. (C–D) Subnetwork constructed with PCR-validated miRNAs (red nodes) and their first neighbors.

