
Figure 9. Comparison of microparticles (MPs) counts isolated from the plasma of UA patients (n = 5) and controls (n = 5).
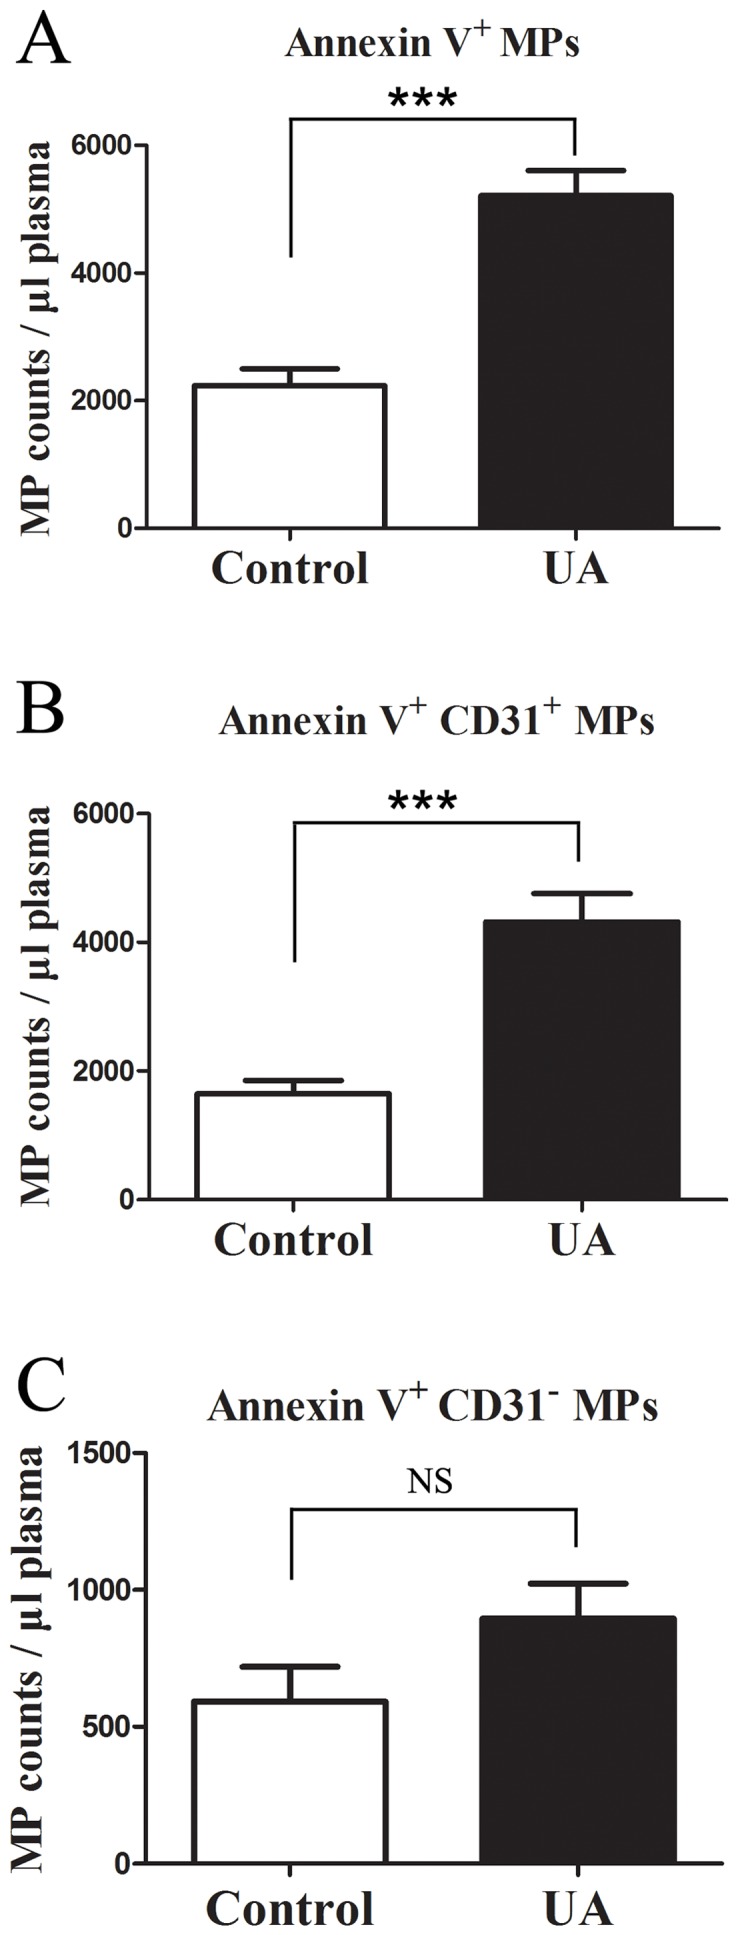
(A) Comparison of Annexin V+ MP counts in the plasma of UA patients and controls. (B) Comparison of Annexin V+ CD31+ MP counts in the plasma of UA patients and controls. (C) Comparison of Annexin V+ CD31− MP counts in the plasma of UA patients and controls. MP counts were determined by flow cytometry. Data represent the mean ± SEM. *** P<0.001; NS, non-significant.