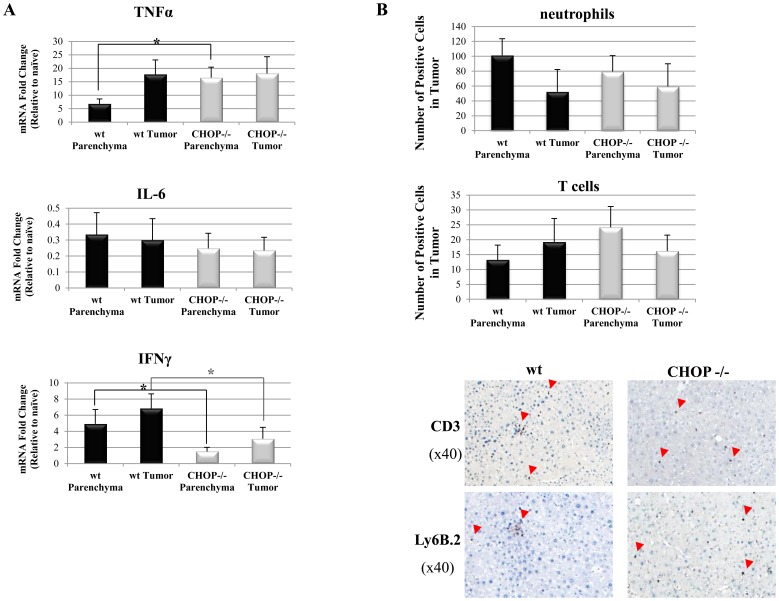
Figure 4. Cytokine levels and immune cell infiltration into DEN-induced HCC.
A. Analysis of cytokines mRNA levels in tumor and parenchyma of WT and CHOP−/− mice (n = 5, p<0.01 for statistical significance). B. Histological sections of liver tissue slides were stained for T cells (anti-CD3) and neutrophils (anti-Ly6B.2). The total number of CD3 or Ly6B.2 positive cells in wt and CHOP −/− tumor and parenchyma were counted (n = 5 for each genotype).

