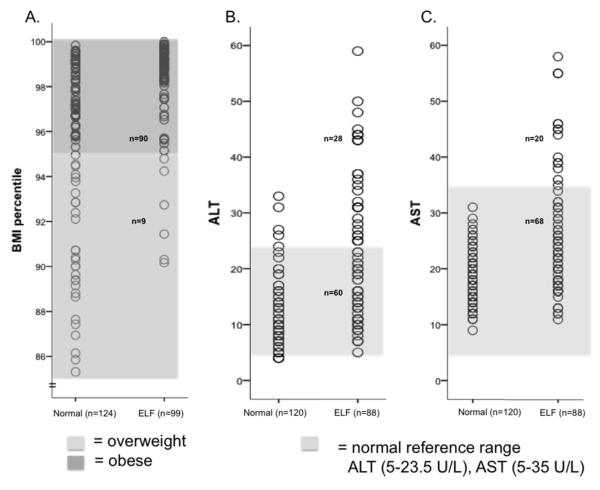
Fig. 1. Distribution of BMI percentile, ALT and AST by liver fat content.
90% of subjects with ELF had a BMI ≥95th percentile (dark shaded box), compared to 64% of participants with normal liver fat content (A). 69% and 77% of ELF subjects had ALT (B) and AST (C) levels, respectively, that were within the normal reference ranges (ALT = 5-23.5 U/L, AST = 5-35 U/L) indicated by the light shaded box. Normal = normal liver fat content, Yes= ELF. ELF = elevated liver fat content defined as ≥ 5.5%.

