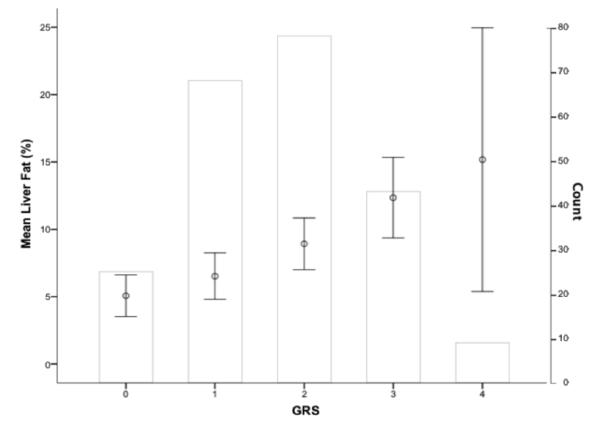
Fig. 2. Combined genetic effects on liver fat content.
GRS category (0-4) is shown along the x-axis and mean liver fat ± 95% CI (open circles with bars) is plotted on the left y-axis. The right y-axis denotes the number of subjects in each GRS category, represented by the non-shaded bars. The distribution of GRS in the population was normal. Mean liver fat significantly increased as a function of GRS (ptrend=3.12 × 10⁻⁵).

