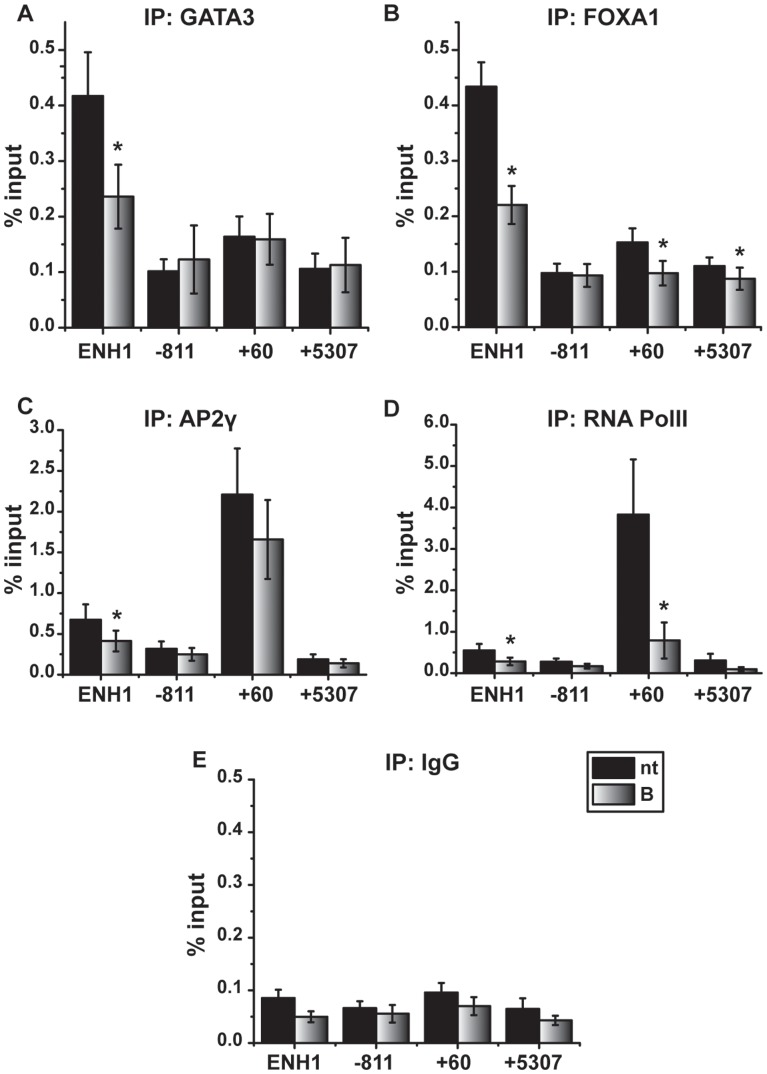
Figure 3. Proteasome inhibition decreases transcription factor occupancy on the ESR1 enhancer and promoter.
MCF7 cells were treated with vehicle (nt) or 30 nM bortezomib (B) for 24 hours and ChIP analyses were performed to examine occupancy at regions of ESR1 depicted in the diagram in Fig. 2A. Data representing a minimum of three independent experiments are presented as percent of input sample for A) GATA3, B) FOXA1, C) AP2γ, D) RNA PolII, and E) IgG (control) on the indicated regions. Data are shown as mean ± SEM. Statistical analysis comparing untreated and bortezomib-treated groups were performed using a Student’s paired t-test. Statistically significant differences of p<0.05 are indicated with an asterisk (*).

