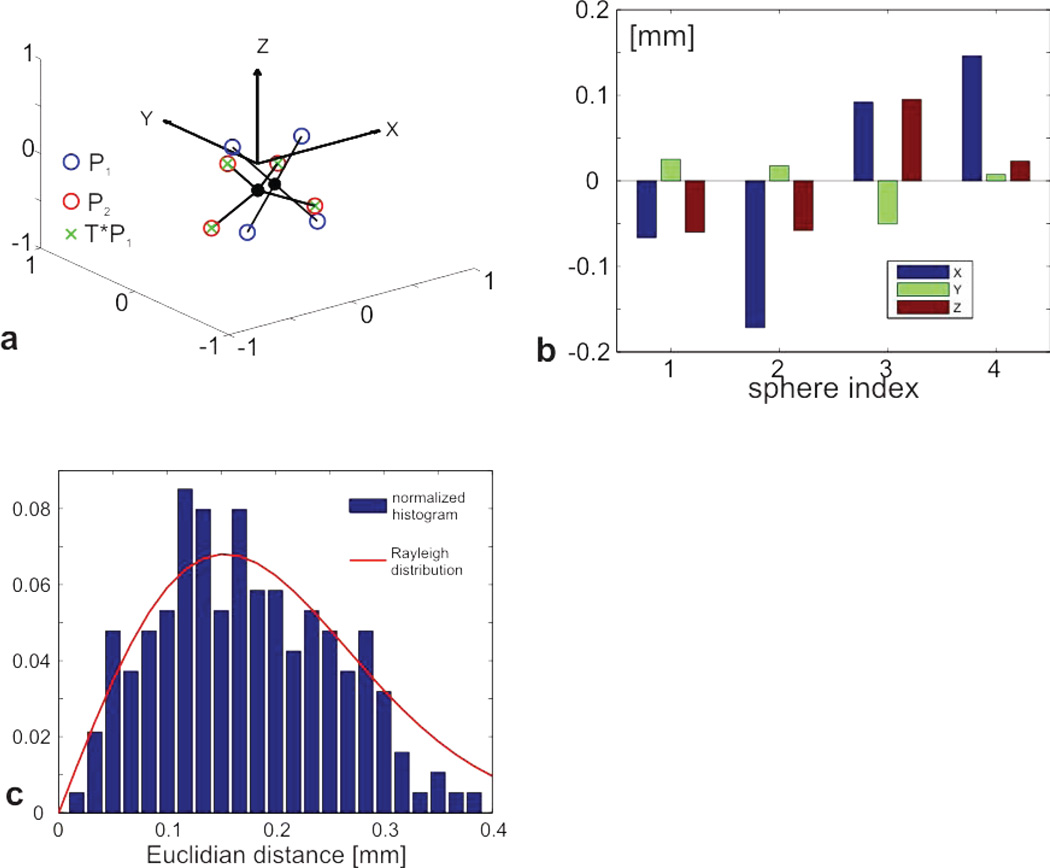
Figure 4.
Application of the SVD-OPP method to arbitrary motion is shown in a. The blue circles represent the initial phantom position P1 and the red circles display the transformed position P2. The green crosses display the resulting transform T applied to P1. The almost perfect match between the red circles and green crosses is an indication for a very accurate estimation of the true transformation. The residual xyz components for a single motion are plotted in b. The distribution of Euclidian distances between original and transformed poses is displayed in c. The normalized histogram matches a Rayleigh distribution with σ = 0.15 mm.

