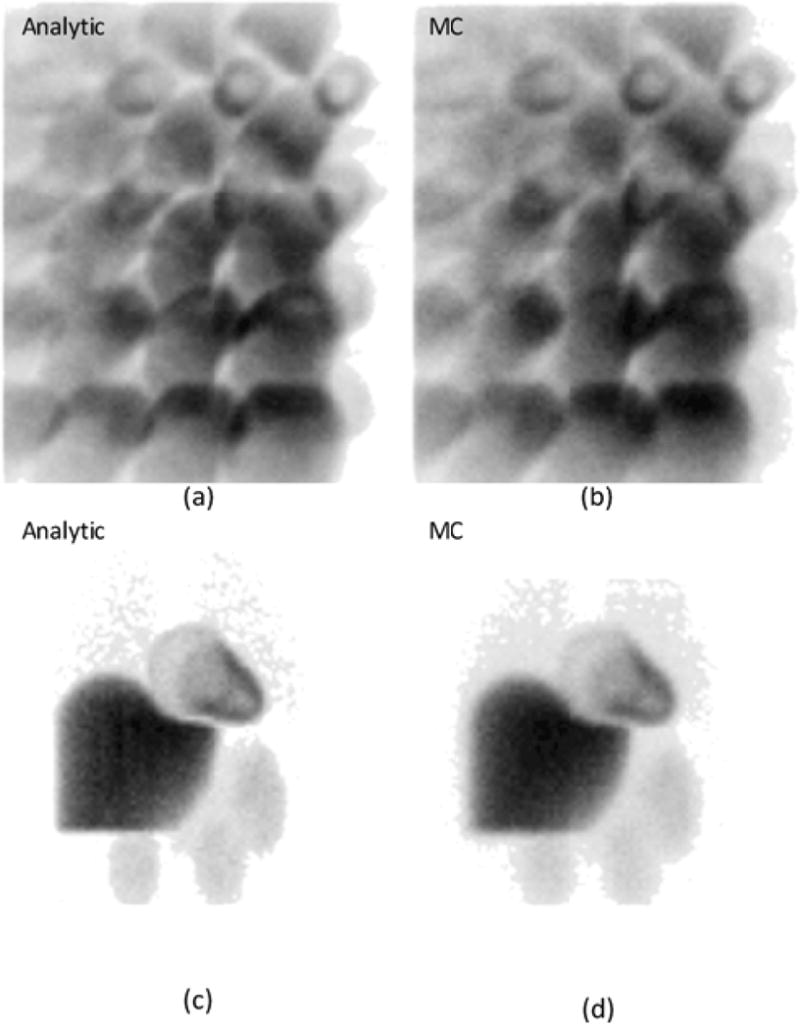
Figure 3.

PH20 (a) analytic and (b) Monte Carlo simulated projections; and LEHR (c) analytic and (d) Monte Carlo simulated projections. The PH20 analytic projection contains 30% more counts than in (b), whereas (c) contains 30% fewer counts than in (d). The latter discrepancy is, in part, explained by the use of hexagonal instead of circular holes in the collimator geometry of the MC simulations.
