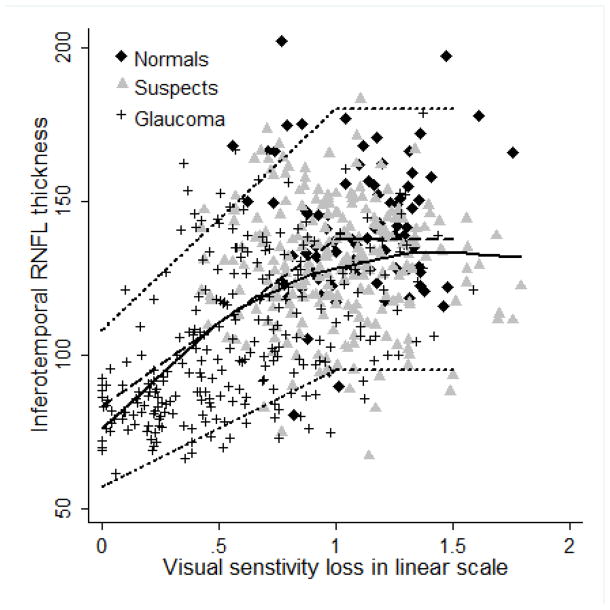
Figure 3.
Linear model showing the relationship between superotemporal retinal nerve fiber layer (RNFL) thickness and inferonasal sector visual sensitivity loss. Solid black line represents the lowess curve fitting our data. Dashed line and the two short dashed lines above and below the dashed line represent the 50th, 95th and 5th percentile of the model.

