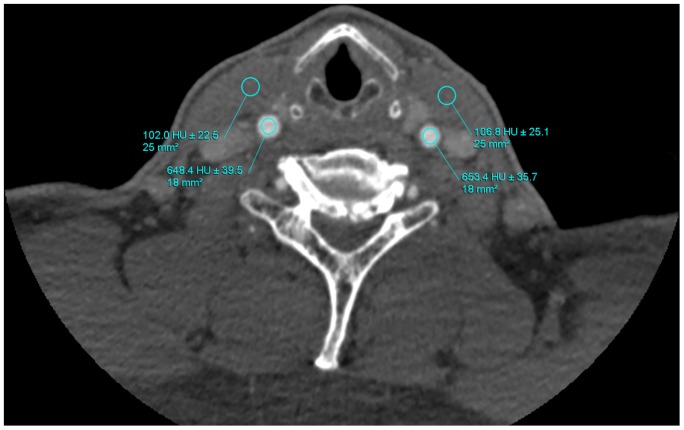
Figure 1. Determination of image noise, vascular attenuation.
The CT attenuation value was measured at circular regions of interest (ROI) placed in the center of common carotid arteries. Data were shown as mean ± standard deviation. Additional ROIs were placed at the sternocleidomastoid muscle adjacent to the vessel contour.

