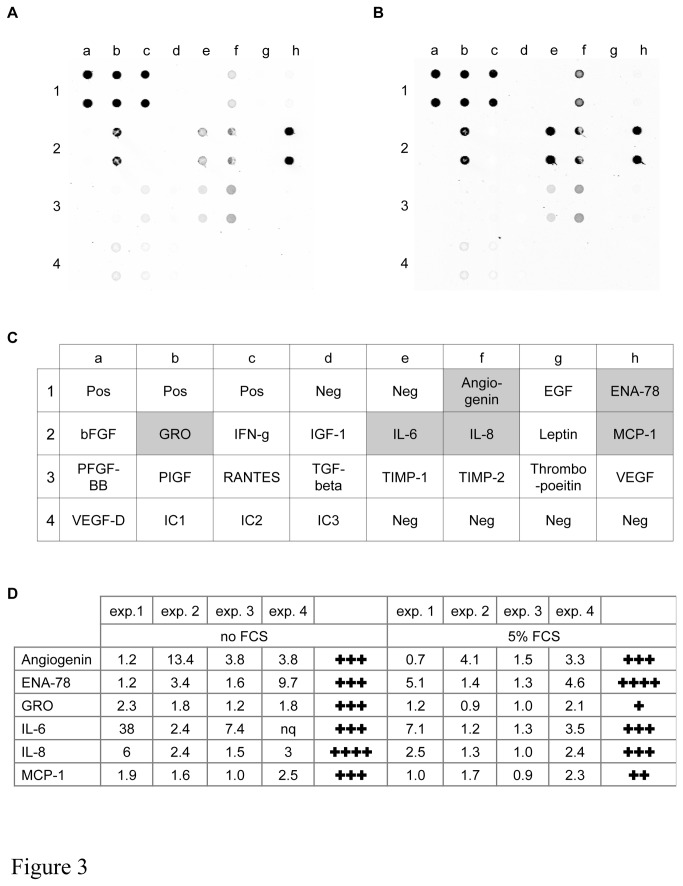
Figure 3. Human angiogenesis antibody array.
Examples of the angiogenesis antibody array (exp. 3) comparing CM from BSMC of non-asthmatic (A) and asthmatic (B) patients. C, Antibody array map. Standard abbreviations for the detected proteins are used, Pos: positive control, Neg: negative control, IC1-IC3: internal controls 1-3. D, Quantitative analysis from each of the 4 independent experiments performed. Intensity ratios (A:NA) in a paired analysis are shown. Upregulation in any single experiment is indicated by a cross. nq = not quantifiable (out of range).

