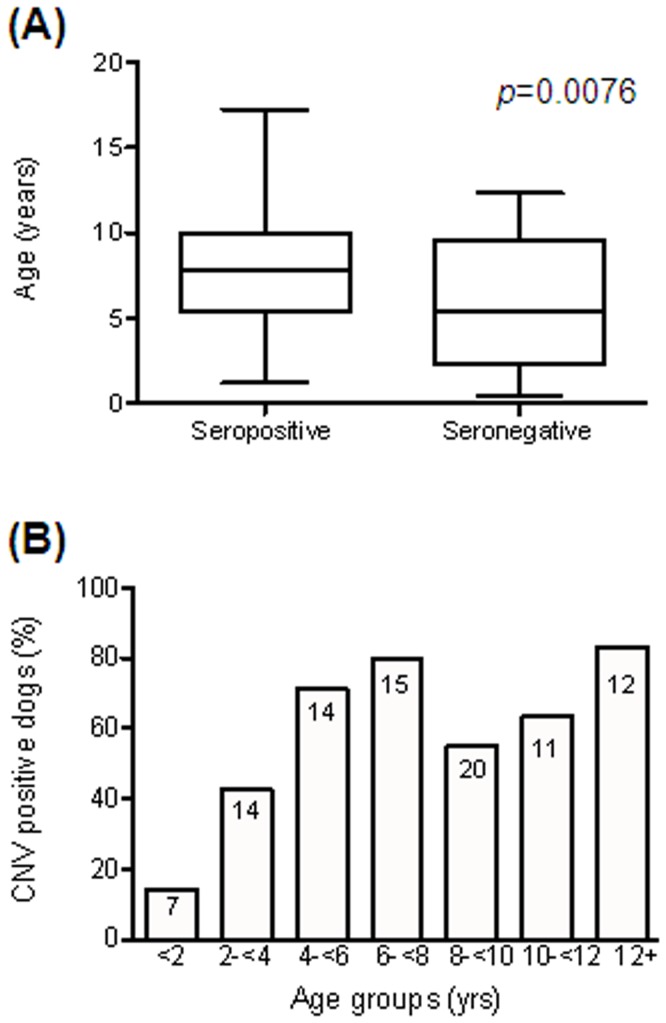
Figure 6. Relationship of CNV antibody status to age.
Age was known for 93 dogs in the 2012–2013 cohort. (A) Box plot of age distribution of dogs relative to seroconversion to CNV. The box represents the interquartile range, with the band inside the box representing the median age. The whiskers are the minimum and maximum of all data. (B) Histogram representing the percentage of dogs that have seroconverted to CNV in each age group. Numbers inside bars indicate the quantity of samples associated with each data point.

