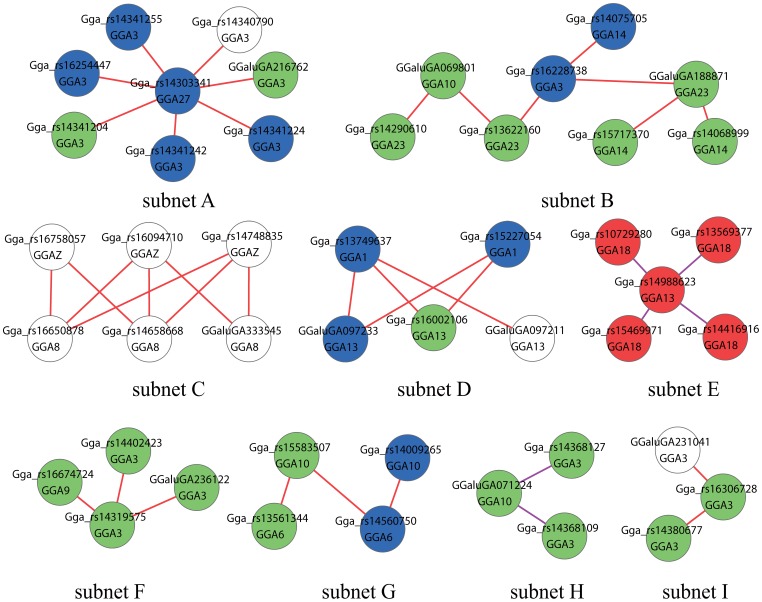
Figure 1. Epistatic network among SNPs affecting abdominal fat weight (AFW) in NEAUHLF.
A node represents a SNP. The chromosome in which the SNP is located is shown in the circle. A pair of SNPs connected by an edge has a significant effect. The colors of the nodes represent P-values of the interaction (P<1×10−13 = red; P<1×10−12 = blue; P<1×10−11 = green; P<1×10−10 = white). The color of the edge indicates the epistatic effect type (AA = red; AD = purple).

