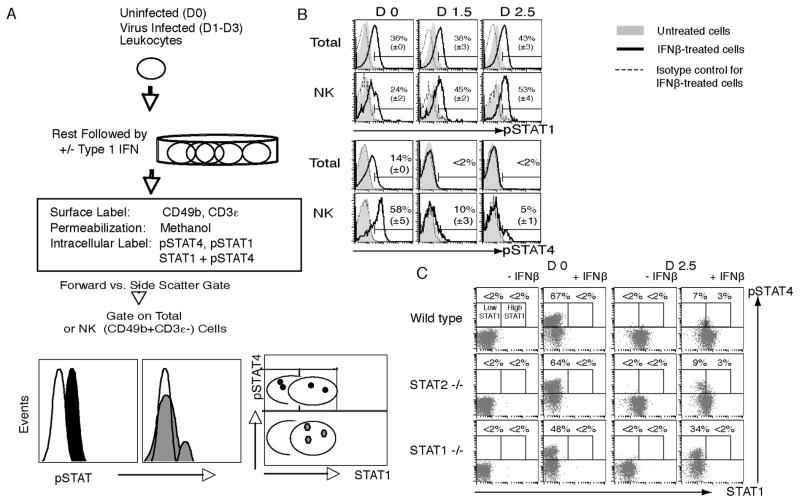
Figure 3. Methods for evaluating type 1 IFN responsiveness with pSTAT1 or pSTAT4 activation.
(A) Leukocytes are prepared from spleens, rested in culture to clear cytokine receptors, and treated with type 1 IFN to induce STAT activation. The cells are then stained to identify the CD49b+CD3ε− NK cells as per Methods 3.3. Intracellular levels of pSTAT1 or pSTAT4 are evaluated using methanol permeabilization. Total cells are evaluated based on gates set by forward and side scatter. Flow cytometric gates set on CD49b+CD3ε− cells allows examination of the NK cell subset. Dot plots of total STAT1 levels with pSTAT4 reveals differences in STAT4 activation associated with increasing concentrations of STAT1. (B) Ex vivo responsiveness of total and NK cells prepared from WT mice on D0, D1.5 and D2.5 of LCMV infection for STAT1 or STAT4 activation in response to type 1 IFN treatment. (C) Evaluation of ex vivo responsiveness of NK cells to type 1 IFN treatment in association with STAT1 levels on D0 and D2.5 of LCMV infection. Populations for analysis were prepared from WT, STAT2-deficient, and STAT1-deficient mice. (Panels B and C were originally published in The Journal of Experimental Medicine, 2007, 204:2382–2396. © Miyagi et al., 2007. doi:10.1084/jem.20070401.)

