
Figure 4.
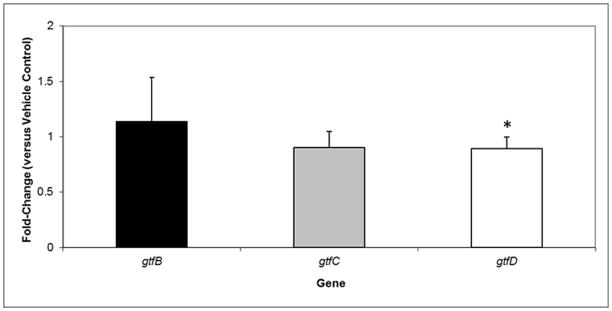
qRT-PCR analysis of gtfBCD expression by S. mutans within biofilms following topical treatments with NV and vehicle-control at 45 h time-point. These values were compared to those from vehicle-treated biofilms (corresponding to an arbitrary value of 1) to determine the change (n-fold) in gene expression. Data are expressed as means ± standard deviations of triplicates from at least three separate experiments. Values marked with an asterisk are significantly different from the value for the vehicle-treated biofilms (P<0.05, Tukey’s test).