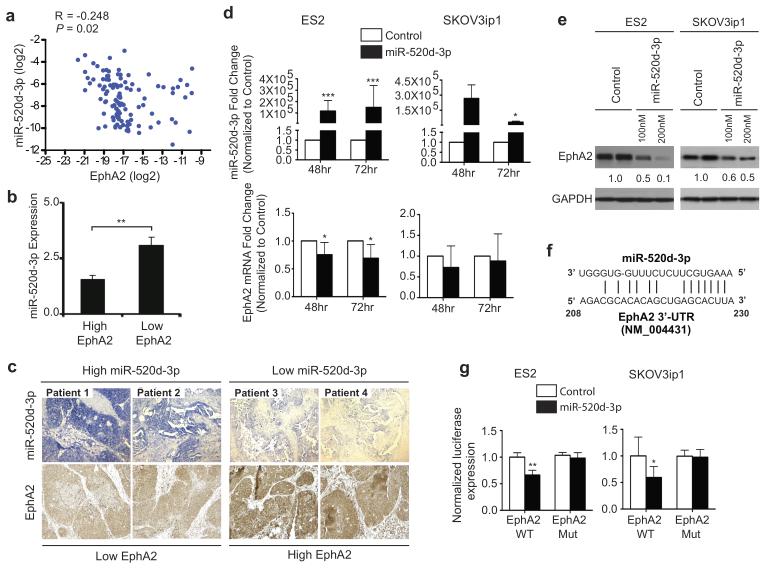
Figure 2. EphA2 is a direct and functional target of miR-520d-3p.
(a) Scatter plot showing negative correlation between EphA2 mRNA (normalized to 18S) and miR-520d-3p (normalized to U6) in MDACC patient set using Spearman’s correlation analysis (R < −0.248; P = 0.02). (b) Quantification of EphA2 and miR-520d-3p immunostaining from four patients showing negative correlation in OC tumors. (c) Representative images of the immunostaining in panel (b). (d) qRT-PCR analysis showing transient overexpression of miR-520d-3p in ES2 and SKOV3ip1 cells (upper panel) results in downregulation of EphA2 mRNA after 48 and 72 hours (lower panel). (e) Immunoblotting of EphA2 and GAPDH in ES2 and SKOV3ip1 cells transfected with miR-520d-3p (100nM or 200nM) or a scrambled control. (f) Representative diagram of the conserved binding site of miR-520d-3p in the 3’-UTR of EphA2 mRNA. (g) Luciferase activity of a reporter construct fused to wild-type or mutant EphA2 3′-UTR in ES2 and SKOV3ip1 cells with ectopic miR-520d-3p expression. Control, cells transfected with a scrambled miRNA control. Data are average of three independent experiments. Statistical significance was determined by unpaired, two-tailed Student’s t test. * P ≤ 0.05, ** P ≤ 0.01, *** P ≤ 0.001 Data are mean ± s.d.

