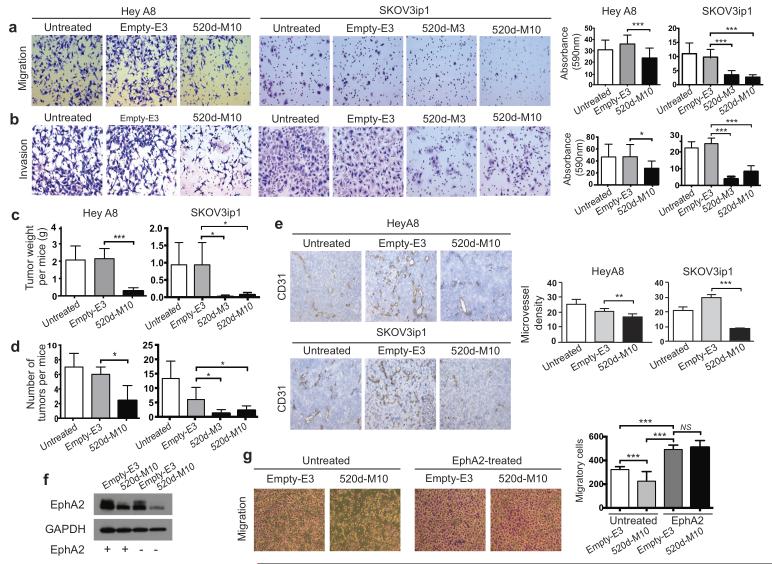
Figure 3. miR-520d-3p expression inhibits migration, invasion and tumor growth.
(a, b) Representative images (at 100×) showing effect of miR-520d-3p stable overexpression on migration (a) and invasion (b) of HeyA8 and SKOV3ip1 cells using Transwell migration and Matrigel invasion assays (Left panel). Absorbance was measured at 590nm after 24 hours. The data from one representative experiment are shown in right panel. Experiment was performed in triplicates at three independent times. (c, d) Total tumor weight (c) and number of metastatic tumor nodules (d) in mice (n = 10 per group) with intra peritoneal injection of miR-520d-3p-transduced or control-transduced or parental untreated HeyA8 (33 days) or SKOV3ip1 (46 days) cells after implantation. (e) Representative images of CD31 staining (at 100×) to identify endothelial cells in untreated, control miR-transfected and miR-520d-3p-transfected HeyA8 and SKOV3ip1 tumors. Quantification of CD31 staining is shown in right panel. A lumen with positive CD31 staining was counted as a single microvessel. Data are average of three independent experiments. (f) Immunoblotting for EphA2 and GAPDH in control or EphA2-transfected HeyA8 empty-E3 or miR-520d-3p-overexpressing-M10 clones. (g) Representative images (at 40×) showing migration of untreated control or EphA2-overexpressing HeyA8 empty-E3 or miR-520d-3p-overexpressing-M10 clones. Quantification of migratory cells counted is shown in right panel. Experiment was repeated in duplicates at three independent times. Statistical significance was determined by unpaired, two-tailed Student’s t test when compared to empty clones for all analyses. * P ≤ 0.05, ** P ≤ 0.01, *** P ≤ 0.001 Data are mean ± s.d.

