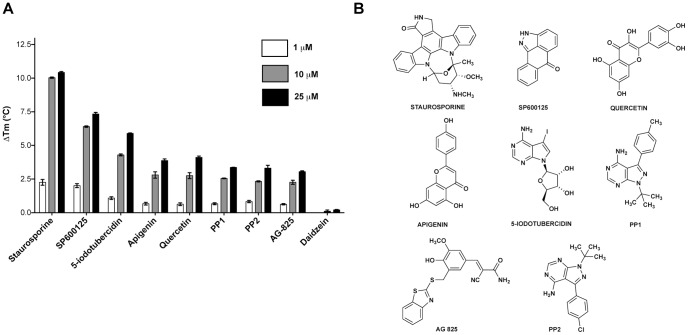
Figure 3. The FTS assay identifies MAP2K4 binders from a library of kinase inhibitors.
A. Graph of ΔTm values of ScreenWell Kinase Inhibitor library hits determined at compound concentrations of 1, 10 and 25 µM. Daidzein (negative control) is also shown. Values shown are the mean ± S.D (n = 3) B. Chemical structures of hits are depicted.

