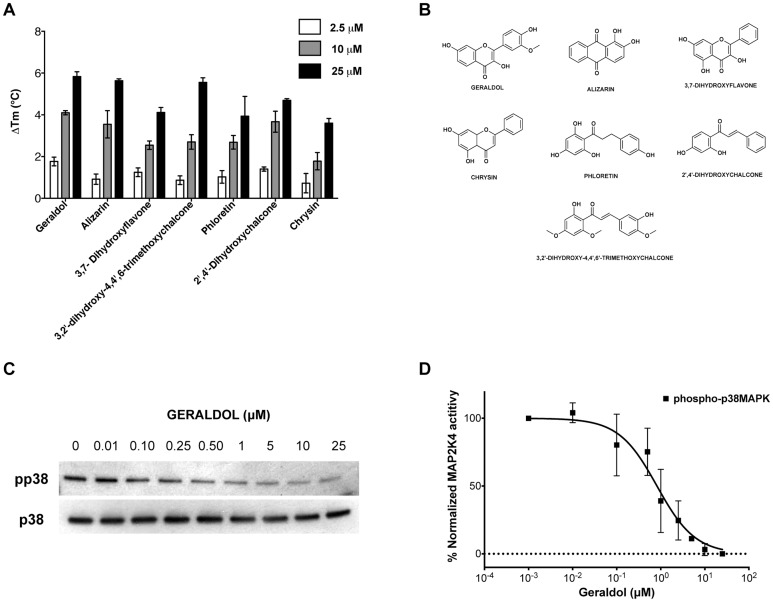
Figure 5. High-throughput screening yields seven additional MAP2K4 inhibitors.
A. Graph of ΔTm values of Spectrum Collection hits determined at compound concentrations of 2.5, 10 and 25 µM. Values shown are the mean ± S.D (n = 3). B. Chemical structures of hit compounds. C. Geraldol inhibits MAP2K4 kinase. Representative Western blot using p38 MAPK as substrate is depicted D. densitometry measurements shown as mean ± S.D from two separate experiments are depicted along with the curve fit used for determining the IC50 value.

