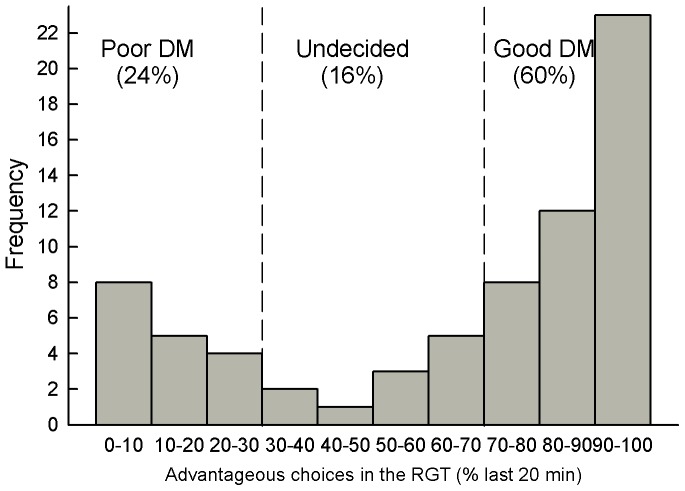
Figure 3. Meta analysis of the RGT data.
This analysis is based on 12 distinct experiments (n = 228) using the same protocol. It reveals a bimodal distribution of RGT scores (% of favourable choices during the last 20 min) with a majority of good decision makers (good DM, with scores above 70%), a minority of poor decision makers (poor DM, with scores below 30%) and the remaining, undecided rats with intermediate scores.

