
Figure 1. The frequency and absolute numbers of CD4+ and CD8+ T lymphocyte subsets in the peripheral blood of HNSCC patients.
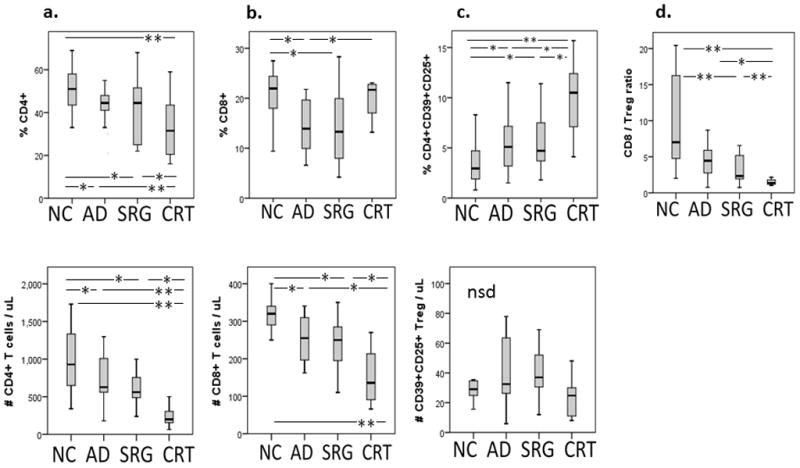
Box plots show median, 25 and 75 percentiles, and the highest and lowest values. NC = normal control (n= 40); AD = untreated active disease (n= 29); SRG = treated with surgery alone (n= 22); CRT = treated with adjuvant chemo-radiotherapy (n= 20). *p< 0.05, **p< 0.01.