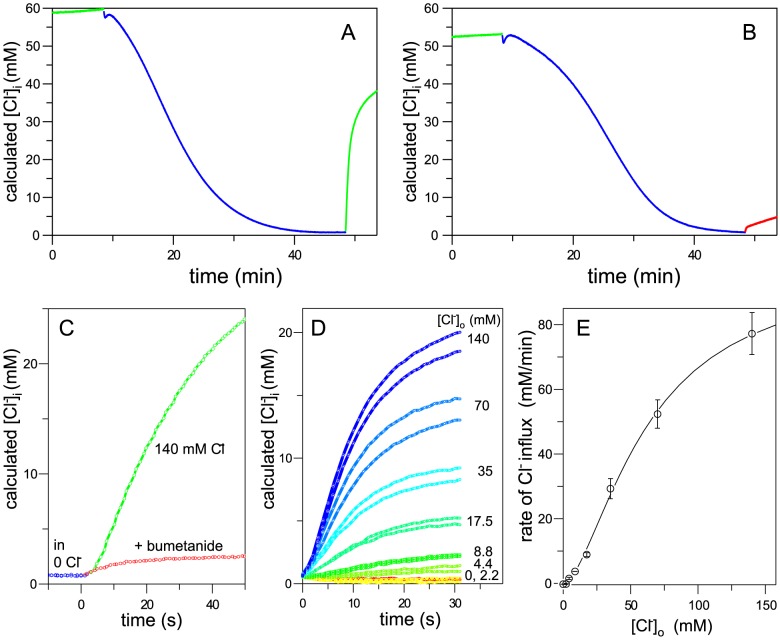
Figure 5. NKCC1 activity determined with Cl−-sensing YFP.
NT13 cells on cover slips (a,b,c) or in a 96-well plate (d,e) were perfused with various media and intracellular Cl− concentration was calculated from YFP fluorescence as described in Methods. A,B,C. Cells were perfused with regular medium (green), 0 Cl− medium (blue), or regular medium with 250 µM bumetanide (red) as shown. Traces from the two coverslips studied in A and B are replotted in C on an expanded time scale starting at ∼48 min. D. Similar to C except cells are in individual wells of a 96-well plate and are monitored on return to media of different [Cl−]. E. Rate of Cl− influx as a function of [Cl−]ext, evaluated as the slope of the data in (D) during the linear phase. The least-squares fit of the data to the Hill equation is shown (Km = 62 mM, n = 1.62).

