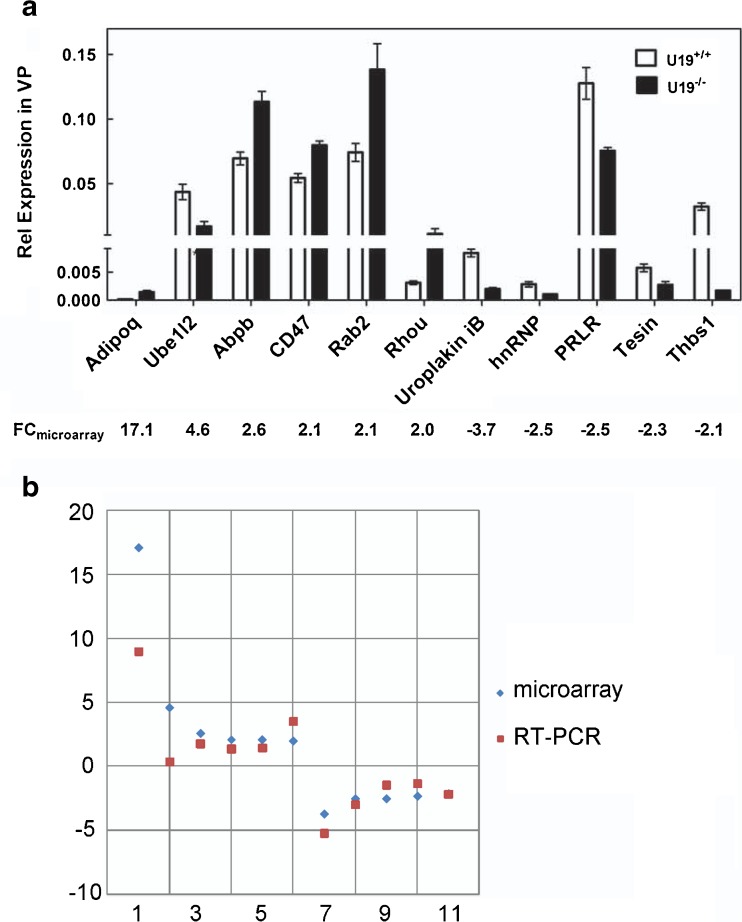
Fig. 2.
Concordance of microarray and qPCR gene expression analyses. a Bar chart of qPCR data results and corresponding array signals. Data were normalized to GAPDH. b Log-fold changes from the microarray platforms are plotted versus the corresponding fold changes from qPCR. R = 0.92. Genes 1–11 represent Adipoq, Ube1l2, Abpb, CD47, Rab2, Rhou, Uroplakin iB, hnRNP, Tesin, Thbs1, and PRLR, respectively

