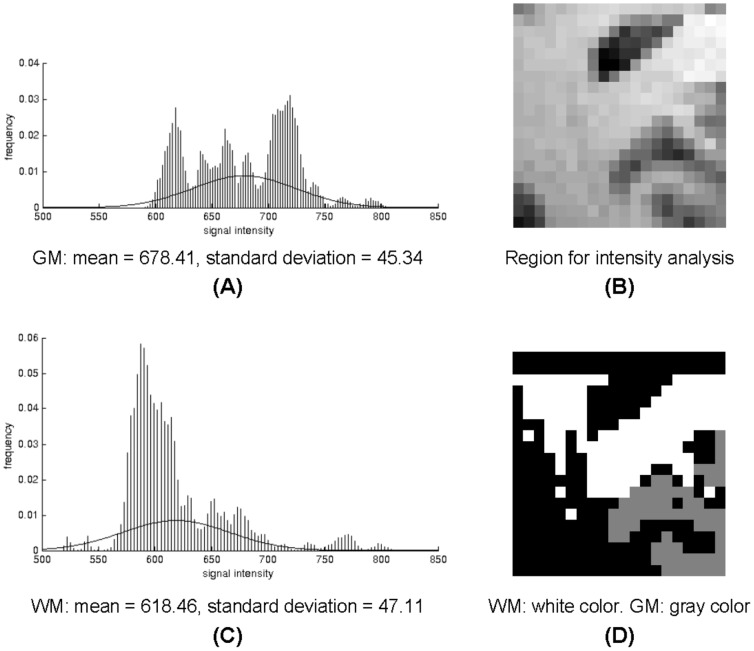
Figure 1. Intensity profiles of BOLD signals in GM (A) and WM (C).
Image in (B) is an enlarged view of the boxed region in Fig. 3D, which is segmented into WM and GM using intensity thresholding (D). Cerebro-spinal fluid and regions of WM-GM intensity overlapping are denoted in black and excluded from analysis.

