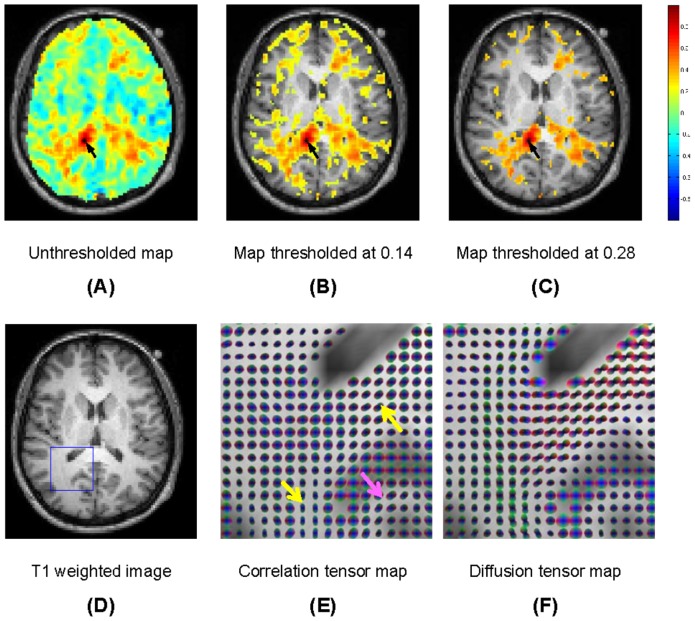
Figure 3. Maps of temporal correlations of BOLD signals to a seed in the corpus callosum.
The background is the anatomic image. Shown from (A) to (C) are maps thresholded at different levels of temporal correlations (see text for explanations). Shown from (D) to (F) are respectively a slice of anatomic T1 weighted image, map of spatio-temporal correlation tensors and map of diffusion tensors for the region demarked in (D).

