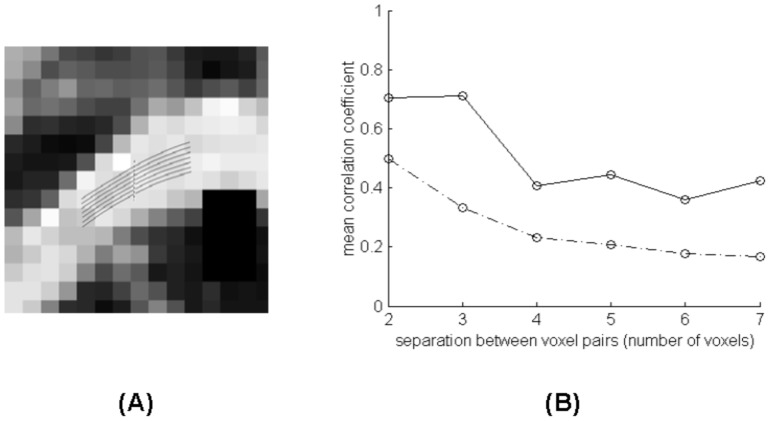
Figure 6. Detailed analysis of correlations along fiber segments tracked in the corpus callosum of Subject One.
The dashed line at the left denotes the seed plane for fiber tracking. The solid curve at the right is the mean correlation coefficient over the seven segments and the dash-dotted curve is the mean correlation coefficient over 1000 random pairs of voxels in the white matter separated by the same distance.

