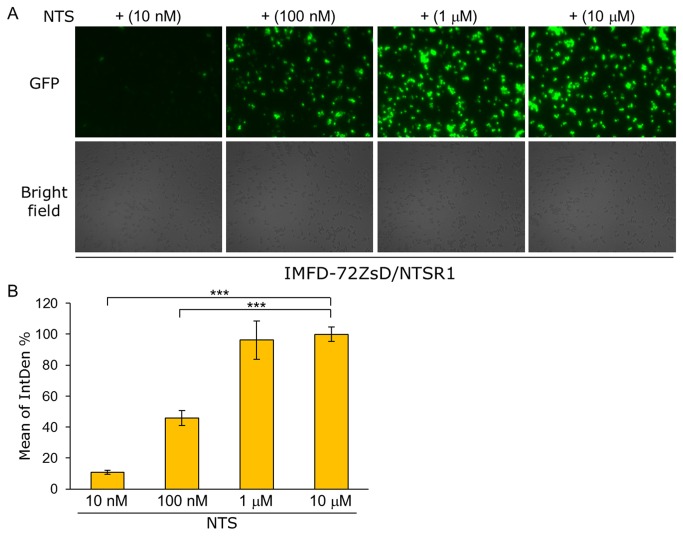
Figure 8. Quantitative digital image analysis of ZsGreen fluorescence using fluorescence microscopy and ImageJ software.
Yeast strain IMFD-72ZsD was transformed with pGK421-NTSR1. The transformant was grown in SD selective medium for 18 h. The cells then were incubated for another 4 h in pH-adjusted SD selective medium with neurotensin (NTS, 13 aa peptide) at several concentrations. (A) Visualization of the green fluorescence. Cells were examined using the 40× objective lens of a fluorescence microscope. Exposure time was 1 s. The upper photographs are fluorescence micrographs, and the lower photographs are bright-field micrographs. (B) The GFP fluorescence of 100 cells was measured as integrated density (IntDen, ImageJ software). Mean values of the green fluorescence signal of 100 cells. IntDen % was represented by relative IntDen normalized with the values of maximal effects of NTS-specific dose-responses. Error bars represent the standard deviation from four separate runs (n = 4); ***, p < 0.001, by one-way ANOVA, Tukey’s post test.

